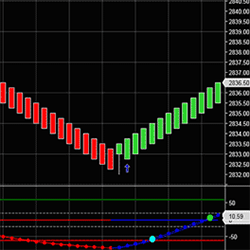
TrendLine Indicator plots red and blue lines to determine the trend. Easily detect the trend direction in any markets so you can easily find ideal trade setups. The red and blue arrows confirm the trend directions and plot above and below the candles.
Experience a revolutionary approach to charts, utilizing moving averages for open, high, low and last prices. Explore diverse chart types, including minute, tick and volume charts. Uncover trends and reversal patterns.
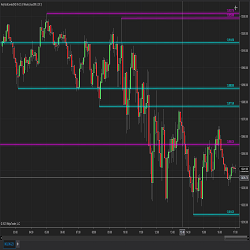
This algorithm calculates the support and resistance based on a look back period (number) of candles or bars and determines the support and resistance levels dynamically.
Learn to trade using a proven righthand trade method by trading two hours a day. 20 hour-long face-to-face sessions. Sessions are captured on video for repeat viewing. Includes candle patterns, harmonics, geometry and an intro to forecasting.
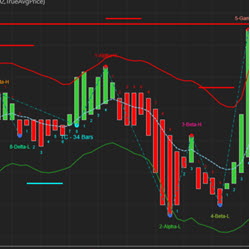
This tool uses price action, trend and momentum to identify price zones (TrapZones) and price bars (TrapBars) where traders can get trapped in the market. Trade good setups while avoiding bad trades e.g. FOMO, catching a falling knife, or fighting the trend, using automated technical analysis!
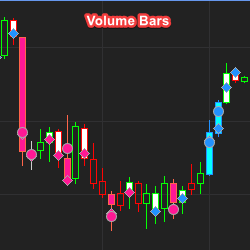
Trade smarter with the volume bars indicator. Follow market dynamics effortlessly, adapting to volume data. Precise, user-friendly, and informed by complex models, it deciphers volume-driven moves, helping you avoid costly mistakes.
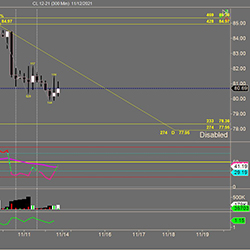
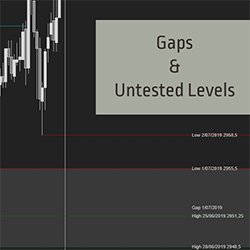
The Gaps & Untested Levels indicator tracks price gaps based on the prior session range or the prior session close. It can also track untested high of session, low of session, and open & close. Notice weak highs/lows immediately and be prepared for every gap fill trade. Start your 2-week trial now!
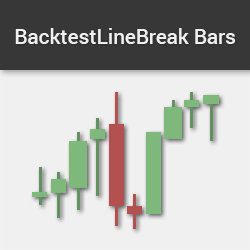
The Line Break Bar is one of the most effective ways to reduce chart noise. It provides accurate back-testing results by showing the correct open prices and restoring the wicks. Easily recognize divergence & price action patterns & eliminate noise from traditional minute charts. Get started today!
Time Or Range is a custom bar type with intervals at a predetermined elapsed time span OR price action range.
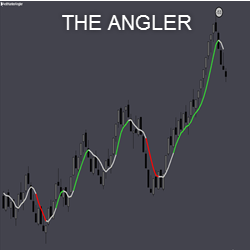
The ability to change colors of a line based on preset angles is revolutionary! Select any up/down trigger angle, any up/down release angle, and receive color changes and alert sounds. Lines stay a triggered color until the release angle is reached. The line then reverts to neutral.
March 25, 2024
Trading Pullbacks and Reversals: Simplifying a Once Complex Retail Trading Strategy
March 21, 2024
VWAP Indicator: Average Price Shown Based on Price, Volume
March 18, 2024
Trade Copier Strategies: Make Efficiency Work for You When Futures Trading
Enter Email for Updates