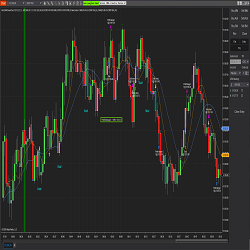
The SMA CrossOver Strategy is one of the simplest, for ease of use and understanding. This simple strategy has been amped-up to include current day price Highs and Lows, Traps, Consolidation, Long Bar and dynamic Bullish and Bearish trend algorithms for precision filtering to find the perfect entry.
Use Statistics to determine intraday High Probability Targets and place stops outside of the regular market noise. This includes Stats on Initial Balance, Mid, Session & Extension ranges, as well as 1-minute rotations & many more! Available for ES, NQ, FDAX & FESX. Download your free report now!
The indicator illustrates volume delta for each bar, emphasizing the contrast between buy and sell volumes. With compatibility for historical and real-time data, it offers diverse display modes. Importantly, users can filter volumes to uncover distinctive behaviors among specific trader groups.
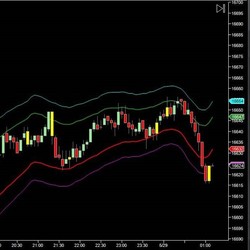
DTB Ultimate Bands is a next-generation of price envelopes that does all the heavy-lifting for traders. Once applied on a price chart, it pinpoints Overbought and Oversold areas with unmatched accuracy. Get a free trial!
3 indicators in 1! The C-Dash is a customizable, check-list style dashboard that comes with The Chompsky Bands Pro and Chompsky Fibs. Includes current ATR Current BPMs (bars per minute), an algorithmically weighted color wheel (weighting is customizable), and more.
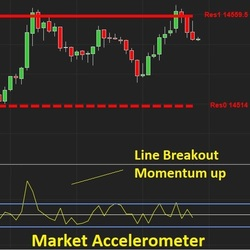
The E.G. AI Accelerometer reveals the driving force behind the price movements of an asset; by measuring how many buyers and sellers are in a market, it helps you form a view of the future direction of the price and – crucially – how fast that movement may be.
PriceIsKing.com's Futures RAM Indicator is based on a powerful moving average pattern recognition algorithm developed with years of research and testing. Get started with a free 2-week trial today!
Apex Investing Institute is a community of “traders helping traders”. They have a live trade room open 23 hours per day, with live commentary and trade set ups called out each morning. Education, systems, indicators, mastery courses and semi-automated trading software.
You can download and try our best indicators for NinjaTrader 8 now! These indicators are free to try. 24-hour technical support and all future updates included. Watch video tutorials on indicator details and how to use them. Hurry! Click here to download and try now!
Toni Hansen’s most popular online trading course is now available as a boot camp! Originally developed by Toni in the late 90s, her straightforward trading methodology has withstood the test of time.
December 2, 2024
Mastering Sideways Markets With Auction Bars and Range Projections
November 19, 2024
Enhancing Your Automated Trading System: Key Insights from Best Pro Trade
November 14, 2024
NinjaTrader New Ecosystem Tools: October 2024 Edition
Enter Email for Updates