You can now calculate how liquid a symbol is based on its trading activity and filter out risky instruments. A higher no of trades a day would mean that the instrument is drawing attention. Start using this powerful screener tool in your market analyzer today!
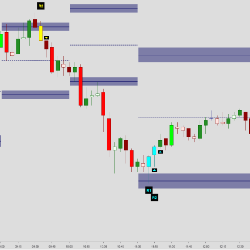
The Auction Bars indicator identifies higher time-frame ranges, displayed as Auction Ranges. These ranges show the current market value area of the ongoing auction. The accompanying congestion zones work as support / resistance where spike and reversal patterns frequently plot.
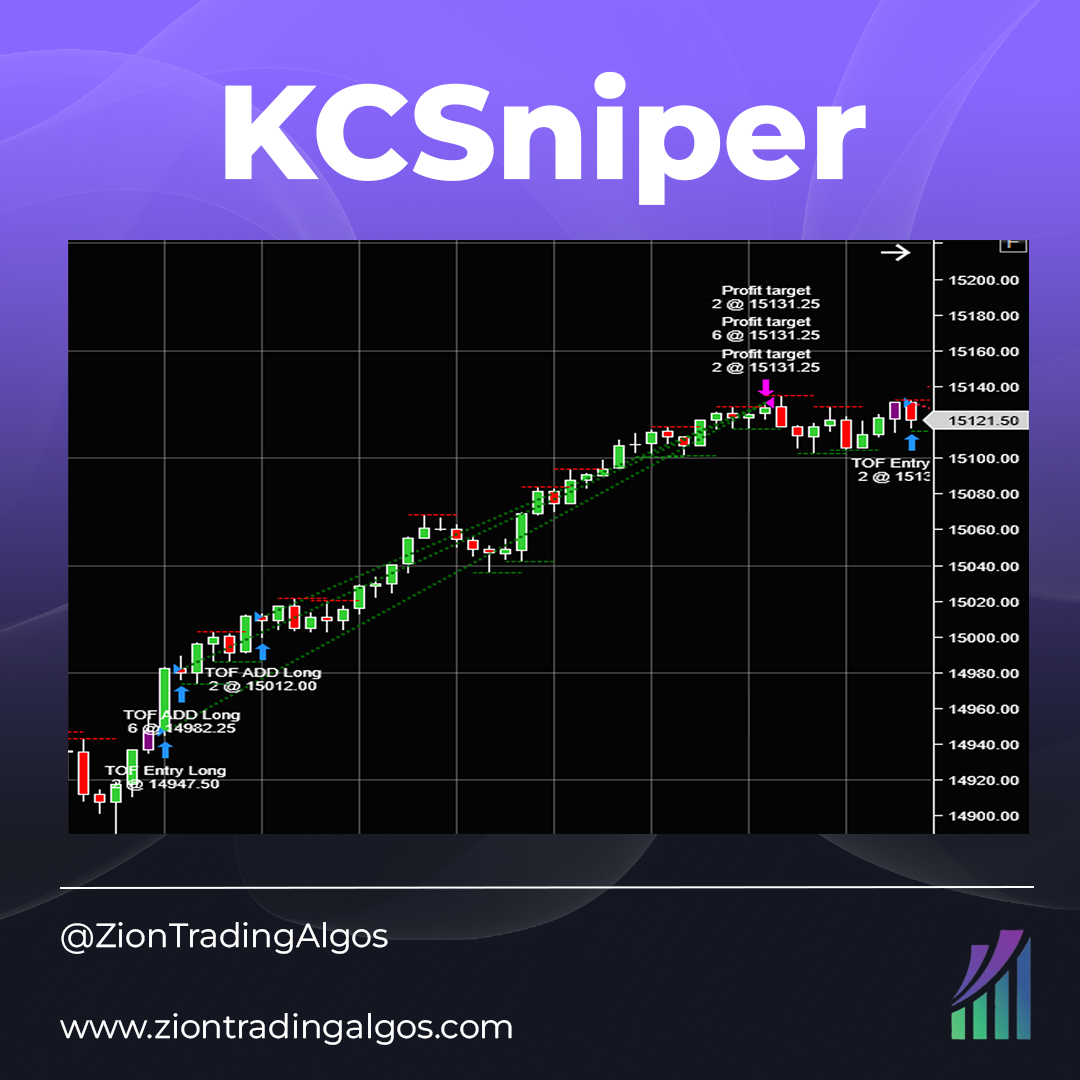
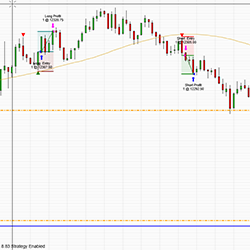
KCSniper is a Keltner Channel-based system on the 10-minute chart. It is long only and does not pyramid into positions, but has a single entry and exit model. It uses volatility based stop loss and take profit targets to remain adaptable. Trades MES and MNQ.
Add the visual benefit of displaying the session open value (settable). Build a visual range of any timeframe you choose. For example, the first 30 minutes of the market open or an hour before the market opens. Choose the end time for a range to stop displaying for the day.
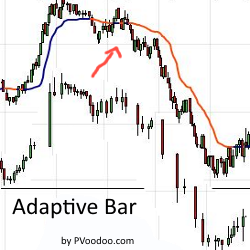
The AdaptiveBar is a revolutionary bar type that incorporates volume, time and range. Available exclusively for NinjaTrader 8 this bar dynamically captures volume and range data based on a user defined time frame to add clarity to market behavior. Learn more!
LizardTrader provides automated strategy programming and consulting services utilizing SharkIndicaors Bloodhound and BlackBird add-ons for Ninjatrader. Contact LizardTrader today for a quote or consulting sessions today!
The program combines TradingTotal traditional technical analysis methodology with the latest technology automated systems & tools. It is carried out through intense online/onsite live seminars & webinars, 'EduHome' video recorded seminars, supportive coaching and a unique individual mentor program.
The Three Line Strike is a trend-continuation candlestick pattern consisting of four candles. Depending on their heights and collocation, a bullish or a bearish trend continuation can be predicted. The strategy can be combined with volume and price action to identify potential trades.
Volatility Quality Indicator (VQI) is a technical indicator that was developed to identify quality stocks with low volatility. The indicator is based on the assumption that assets with low volatility are less risky & more stable. The original concept by Thomas Stridsman was first published in 2002.
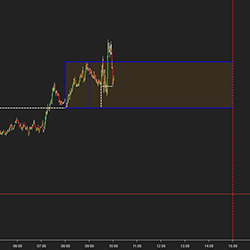
The Job Pivot is a volume profile analysis that allows the user to gauge a directional bias with price targets. It provides an equilibrium between buyers and sellers for the purpose of identifying control of the session’s auction.
December 2, 2024
Mastering Sideways Markets With Auction Bars and Range Projections
November 19, 2024
Enhancing Your Automated Trading System: Key Insights from Best Pro Trade
November 14, 2024
NinjaTrader New Ecosystem Tools: October 2024 Edition
Enter Email for Updates