Market Volatility Harvester™ is a fully automated trading system that uses quantitative & technical trading strategies to only trade E-Mini S&P 500 futures. The automated trading system looks for long & short trade setups. Get Mach 1 trial version automated trading system today, backtest it to 2008!
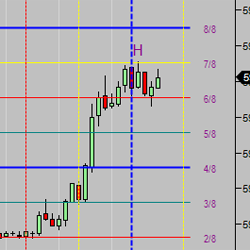
Why use a Murrey Math indicator that calculates only once or hourly instead of by the rules? MMlinesProPlus can do that. Traders also see where the lines recalculated and shifted. In Historical Mode, see the lines where they actually were at various times. It includes adjustable frame size and more.
This is a breakout trading strategy using an ATR trailing stop as exit.
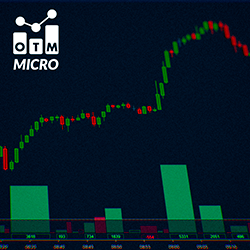
The OTM Micro Delta indicator allows you to identify buying or selling interest. With a reference threshold, it filters out significant movements. It is useful for detecting large price movements.
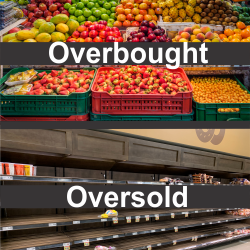
No subchart indicators or additional time frame charts are required to see when price becomes overbought or oversold. This helps the trader identify weakness in an uptrend or strength in a downtrend to anticipate a potential change in price direction. An award winning "heads-up display" indicator!
A complete course designed to teach you how to install NinjaTrader 8, how to install our templates and custom indicators, and how to day trade S&P Futures. Our method is similar to swing trading and scalping combined - but trades are only for the current day. Three-day money-back guarantee.
There are dozens of free RSI indicators available, but only the Ultimate RSI has all of their features and options rolled into one powerful trading tool! It also comes with the “RSI: The Day Trader’s Secret Weapon” guidebook explaining different ways to trade with the RSI. Get it now for free!
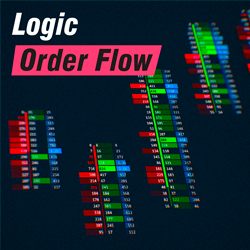
A cutting-edge indicator designed to make order flow trading both effective and enjoyable. Featuring an intuitive footprint chart, it provides valuable insights into historical and real-time market activity. The footprint chart reveals buy and sell volumes and order flow within each price bar.
Logic order flow features unique and easy-to-use graphical options, one-click presets and configurations, a profile, footer, and databox for a complete market analysis. It guarantees the best visualization of patterns and zones, making this tool one of the best options on the market.
ClearAdapt ML showcases a unique automated deep learning model that fuses an intelligent and seamless system for optimal trade performance. The model works by extracting historical market data and takes on a rule-learning path for pattern recognition and trade entries; minimizing prediction error.
December 2, 2024
Mastering Sideways Markets With Auction Bars and Range Projections
November 19, 2024
Enhancing Your Automated Trading System: Key Insights from Best Pro Trade
November 14, 2024
NinjaTrader New Ecosystem Tools: October 2024 Edition
Enter Email for Updates