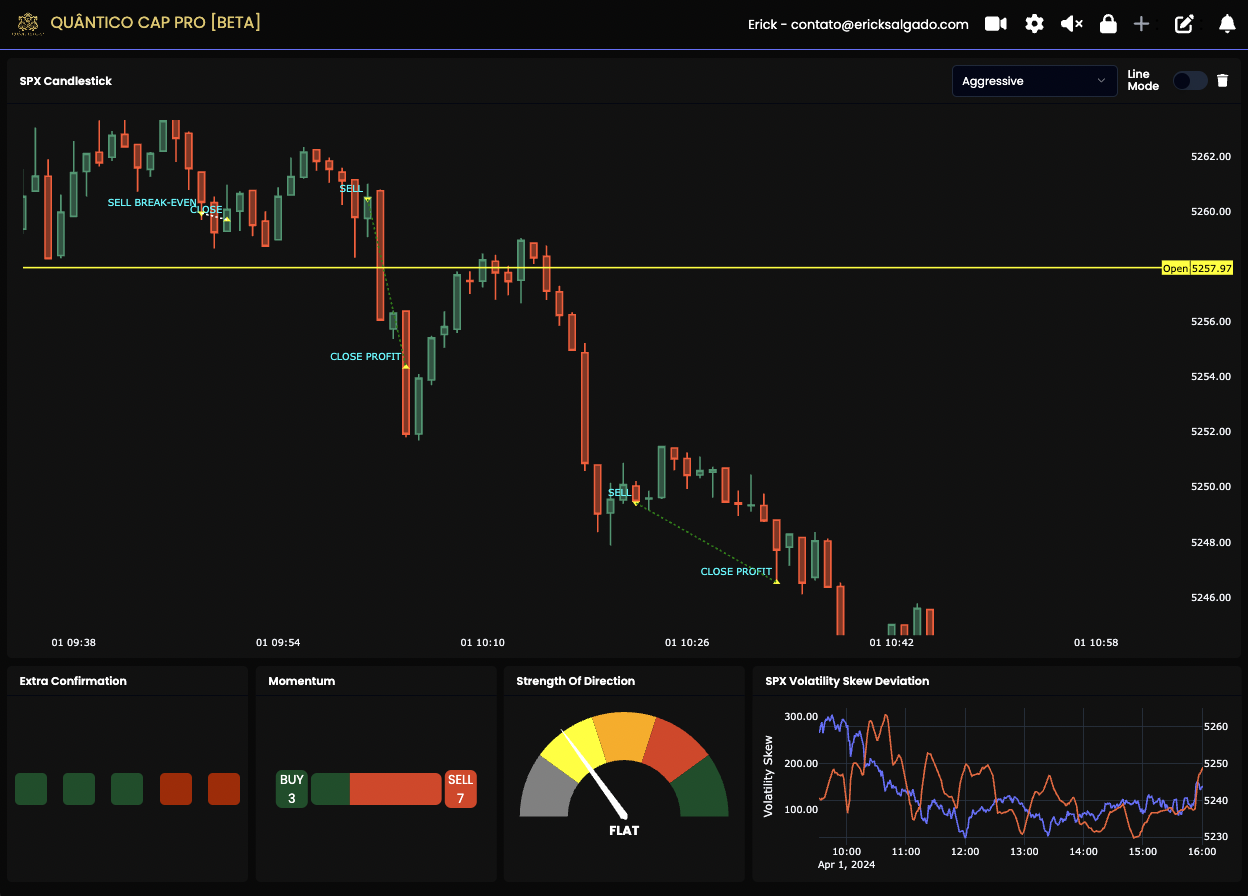
ClearAdapt ML showcases a unique automated deep learning model that fuses an intelligent and seamless system for optimal trade performance. The model works by extracting historical market data and takes on a rule-learning path for pattern recognition and trade entries; minimizing prediction error.
Unfinished auctions act like magnets for price. The stronger the imbalance, the stronger the pull. Optimal Unfinished Auction plots these levels and imbalances automatically on your chart. Bring order flow to your trading without over-complication! Strategy Builder compatible.
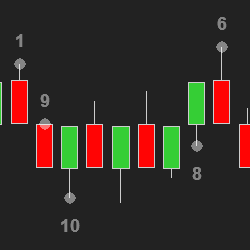
The Epic U-Turn indicator is based on volume & previous price action to confirm that power has switched from buyers to sellers. For intraday or swing trading, these are also known as reversal bars, turnaround bars or engulfing reversal patterns. Strategy supports algo-trading. Download a free trial!
Know that you’re an amazing trader but finding the funds to get started is the one thing standing in your way? At UProfitTrader, we can help! Simply choose the size account you’d like, show us what you’ve got through our unique testing process, then start turning your passion into a profession.
The VIP Membership at EminiMind is designed to help improve your trading consistency through weekly live trading sessions, a series of structured trading videos, and weekly trade recap and analysis that will walk you through all of the trading methods they use.
The Spread Trading Tool add on for NinjaTrader 8 allows for charting a variety of spread combinations from 2 leg 1:1 ratio spreads to more advanced butterfly spreads. A control panel connected to the strategy allows for easy entry and management of spread trades.
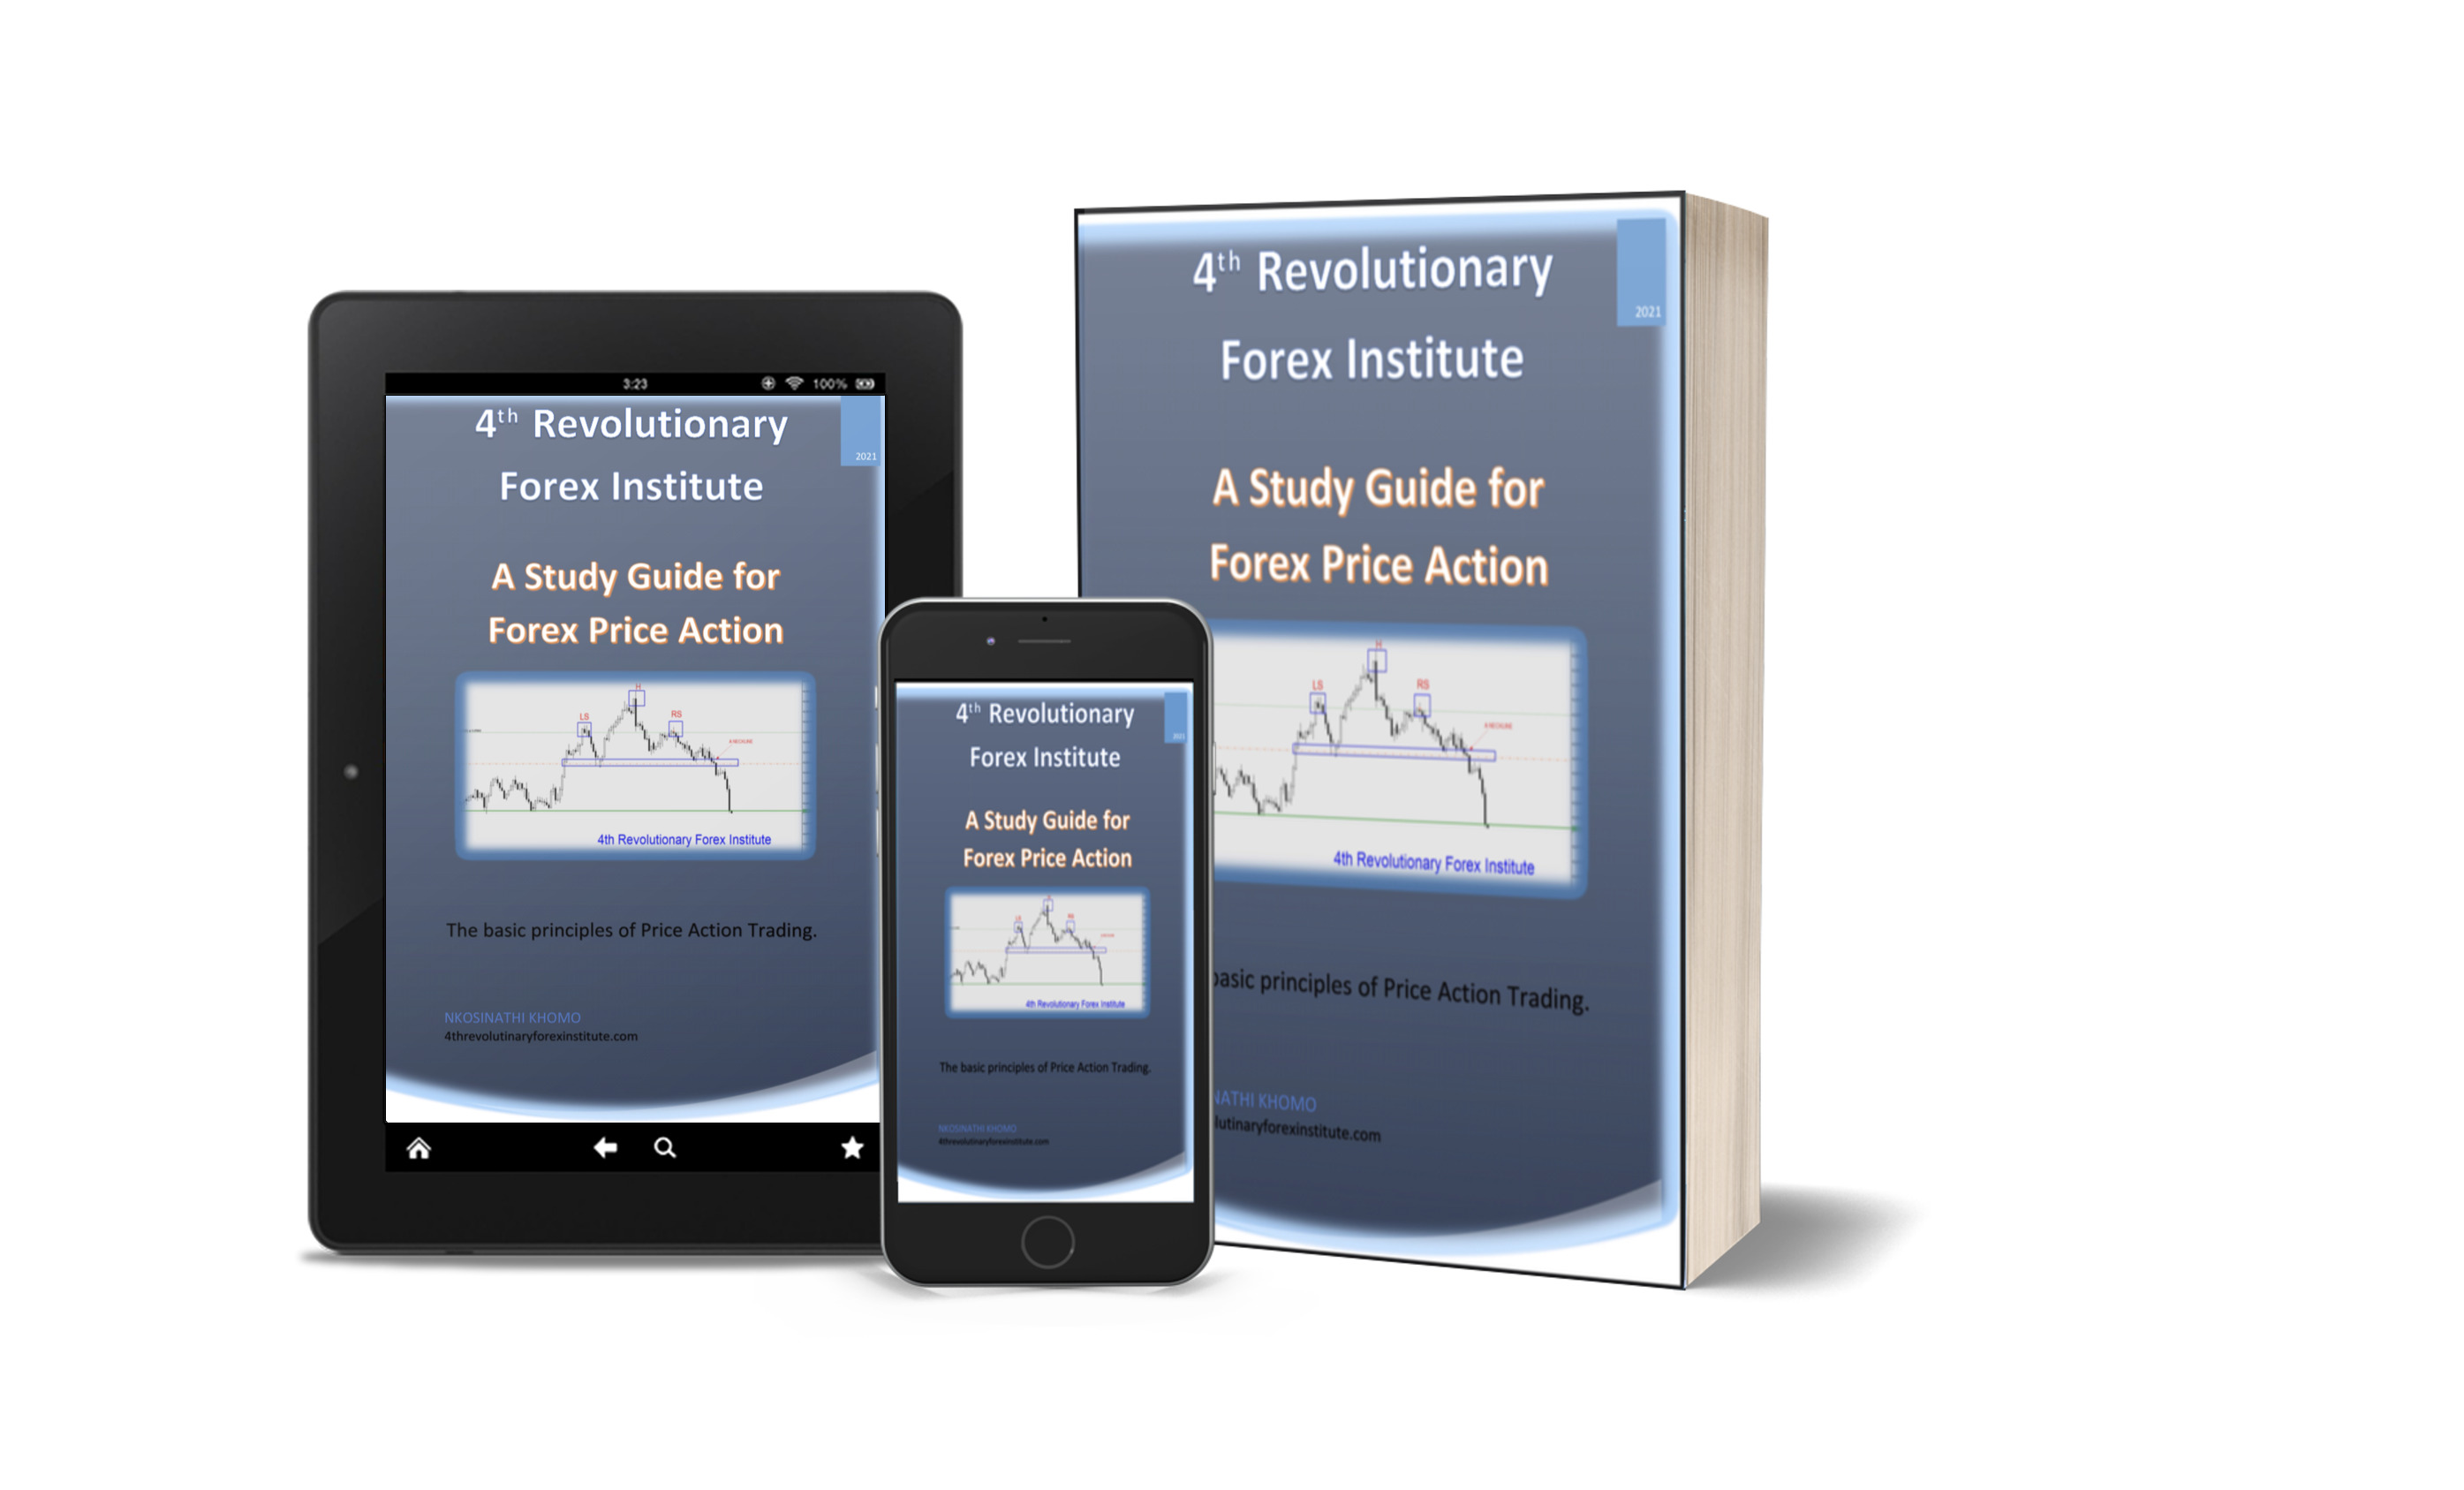
This study guide covers most of chart patterns of the price action. The study will cover trendline strategies, candlesticks patterns, chart patterns, Elliot Wave Theory, harmonic patterns, risk management, trading plan and trading psychology.
Access clear buy and sell signals tailored for trading precisely when our algorithm detects market maker interventions. Exclusively offered for ES and NQ, seize the opportunity to join our community of hundreds of traders already leveraging 0DTE and Market Maker setups.
This training, accessible to beginners and experienced users, explains step by step how to properly read the Orderbook and the Tape. At the end of the training, you will have all the knowledge and trading strategies necessary to be able to trade with confidence and logic on the markets.
Accrue Inc. didn’t invent seasonality – they just made it easier to see and trade! Almanac™ Calendar Analytics creates better awareness of seasonality with 90-day price projections across five different market scenarios.
December 2, 2024
Mastering Sideways Markets With Auction Bars and Range Projections
November 19, 2024
Enhancing Your Automated Trading System: Key Insights from Best Pro Trade
November 14, 2024
NinjaTrader New Ecosystem Tools: October 2024 Edition
Enter Email for Updates