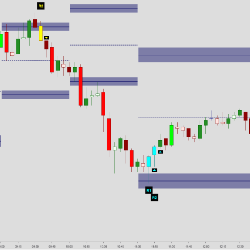
The Auction Bars indicator identifies higher time-frame ranges, displayed as Auction Ranges. These ranges show the current market value area of the ongoing auction. The accompanying congestion zones work as support / resistance where spike and reversal patterns frequently plot.
Get on your optimal track to becoming a live trader with total support from experienced presenter status members. Receive NinjaTrader navigational assistance, 12-month access to live, recorded, & on-demand FNL webinars & 2-month access to our FNL Trader Creator knowledge system.
T2SSupplyDemand is an indicator used to enter high-probability trades. Get notified in real time by email, text message or your favorite sound when the price is about to enter key zones & when it touches fresh zones. Don't stare at a screen, wait for the right signal in supply and demand zones.
Connect to a remote desktop from work, home or business trips. Monitor your trades from any location. Your automated trading strategies can run 24/7, without the risk of the computer shutting down. 1 GB/S, low latency, Intel Xeon, USA located, 24/7 access.
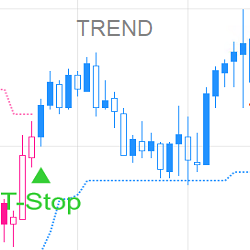
This strategy is a trailing stop indicator turned into a fully automated strategy on "autopilot" that manages trades from open to close. Follow the trend on any time frame of your choice - available as lifetime purchase or monthly lease.
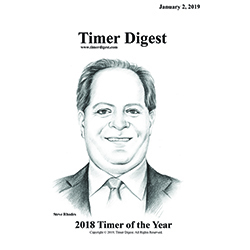
Discover our daily trading and investment newsletter service provided by the #1 Market Timer of 2018 as ranked by Timer Digest.
A daily S&P futures email report published before the pit session so traders can be prepared and have an actionable trade strategy plan with relevant probability price targets.
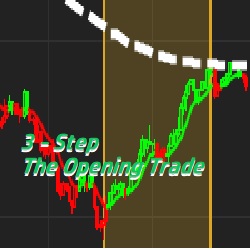
The 3 Step Indicator and Workspace package from The Opening Trade combines three basic elements into a simple Red vs Green color coded, Mean Reversion Discretionary System. Price Action, Trend Strength and Supply and Demand are what drive this 3 Step System.
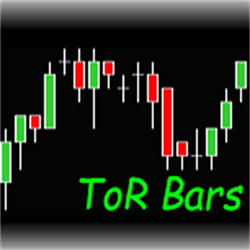
Time Or Range is a custom bar type with intervals at a predetermined elapsed time span OR price action range.
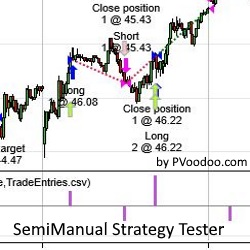
Do you have an idea which you would like to test without actually writing the strategy code to get the trading results? A simple way to do that is by using the PVAddManualTrades and PVUseManualTrades strategies, both utilizing statistics and options from the Strategy Analyzer. Try them free!
March 25, 2024
Trading Pullbacks and Reversals: Simplifying a Once Complex Retail Trading Strategy
March 21, 2024
VWAP Indicator: Average Price Shown Based on Price, Volume
March 18, 2024
Trade Copier Strategies: Make Efficiency Work for You When Futures Trading
Enter Email for Updates