Would you like to learn how to code your own strategies, indicators, bar types, optimization algorithms and amazing .NET extensions? This course, taught by Yuri Zolotarev, contains over 60 lectures and more than 5 hours of content. In addition, we are always updating this program with new material.
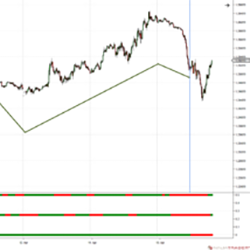
The EnlightCoders HeadScalper gives you market direction with a traffic light plot – red or green. SAT (Scalp Auto Trend) is a versatile and self-adapting tool to identify what is happening in the big picture. It reduces noise with smart filters and shows just one thing: the trend in red or green.
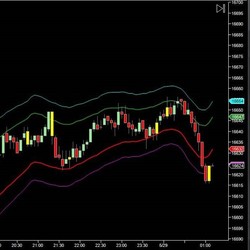
DTB Ultimate Bands is a next-generation of price envelopes that does all the heavy-lifting for traders. Once applied on a price chart, it pinpoints Overbought and Oversold areas with unmatched accuracy. Get a free trial!
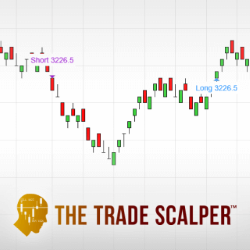
Use the Trade Scalper to pinpoint the exact moment you should place a scalping trade. What is scalping? Fast, in & out trading - multiple times per day. Included are both video and live training.
100% FREE - The TAS Market Map Indicator delivers the most visually appealing customizable market profile tool for traders. Its color-coded sideways histograms clearly reveal volume at price, value areas (red zones), master point of control lines (aqua lines), gaps and congestion.
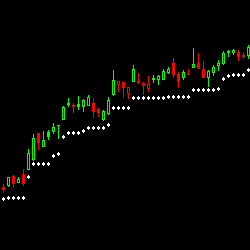
Based on ATR our Trailing Stop indicator has been designed to take all the hassle out of calculating and re-calculating your ‘stop losses.' It does this for you automatically. It also alerts if your stop is hit. A must for day and swing traders.
Emet Trading Solutions is a team of experienced programmers focused on trading. They offer strategy and indicator conversion from NinjaTrader 7 to NinjaTrader 8, or from NinjaTrader 8 to NinjaTrader 7. Their services include an individual approach and ongoing technical support. Get a free quote!
Using Renko/range/tick/volume bars? Optimal Speed analyses the length of time a bar took to form in order to highlight possible congestion areas. Instantly see the slowest bar of the session, slower-than-average bars, crawl bars and the slowest up and down bars of the day. Strategy compatible.
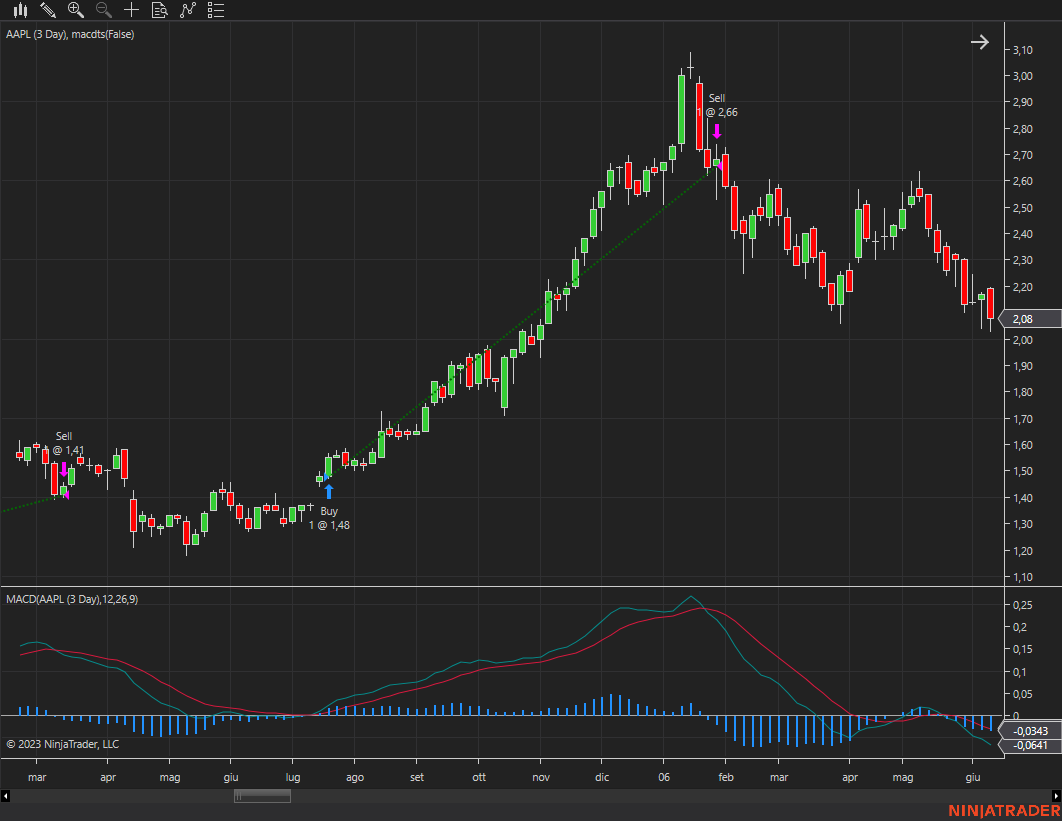
Trading system based on the MACD indicator, exploiting breakouts and trend persistence.
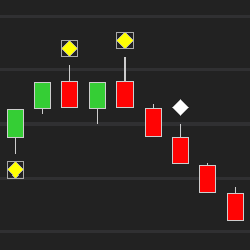
No subchart indicators or additional time frame charts are required to see when price becomes overbought or oversold. This helps the trader identify weakness in an uptrend or strength in a downtrend to anticipate a potential change in price direction. An award winning "heads-up display" indicator!
December 2, 2024
Mastering Sideways Markets With Auction Bars and Range Projections
November 19, 2024
Enhancing Your Automated Trading System: Key Insights from Best Pro Trade
November 14, 2024
NinjaTrader New Ecosystem Tools: October 2024 Edition
Enter Email for Updates