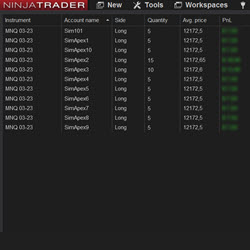
With this tool you can copy your own trades to multiple accounts from the same broker. If you use Propfirms with multiple accounts this is a must have for you. You can trade up to 20 accounts, open orders between different instruments, and have the possibility for an order multiplier.
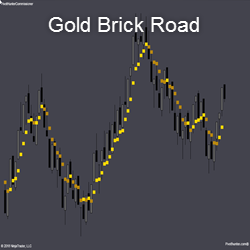
THE COMMISSIONER is only interested in the one single price of a bar/candlestick that has accumulated the most volume on close. This iteration is “The Gold Brick Road”. It gives a quick simple visual of consolidation and trend. When the bricks separate, a trend is predicted.
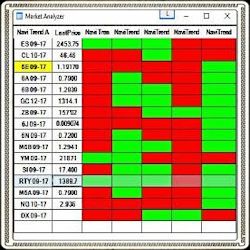
Utilizing pre-built indicators, the TrendFinder shows the probability of a market trend and price action continuation or termination, in real time. This Market Analyzer enhancement examines corresponding, short or long term and beginning or ending market trends with ease. Learn how!
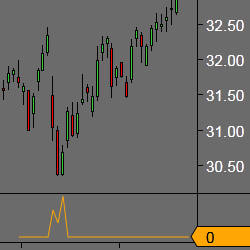
Precision Divergence Finder is designed to find bullish divergences in Demand Index readings in real time with no delay or re-painting. It can often pinpoint precise market bottoms and using this product can give you the insight needed to increase the chances of finding the exact market low point.
This tool uses price action, trend and momentum to identify price zones (TrapZones) and price bars (TrapBars) where traders can get trapped in the market. Trade good setups while avoiding bad trades e.g. FOMO, catching a falling knife, or fighting the trend, using automated technical analysis!
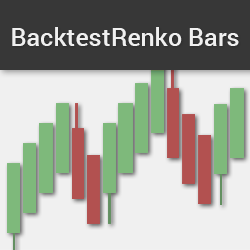
The hybrid Renko bar is two bar types in one. With adjustable backtesting capability, it utilizes true trade data for the Open, High, Low, & Close of each bar. Price gaps are accurately portrayed on the chart. Eliminate chart noise with one of the most precise Renko on the market. Get it now!
As a NinjaScript Consultant since 2008, Moore Tech, LLC has the experience to provide the solutions traders need. Whether traders are looking to have code converted from another platform, or bring their trading ideas to life, Moore Tech, LLC can help. Contact them today for a free project estimate!
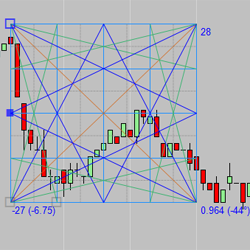
The IT_GannBox tool is fully loaded for chart analysis price prediction. This tool has all types of visual features and three modes of operation. Industry standard Fixed Ratio and FreeForm modes plus the custom FreeForm Ratio mode. Adding the IT_ChartSquare tool will allow visually accurate angles.
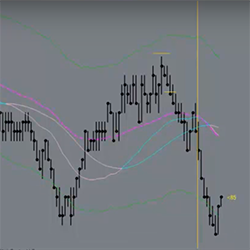
FREE indicators and workspaces to follow along with Horst's YouTube tutorials and videos. Check out live daily YouTube trades on the website & discover the ability to see upcoming moves clearly & logically before they happen. Download the free workspaces & indicators today!
High rated Quant Developer/Trader specializing in NinjaTrader. They have worked with high profile clients/organizations and have professional experience working at an Algo trading desk. They focus on providing value to all their clients and earning their trust.
December 2, 2024
Mastering Sideways Markets With Auction Bars and Range Projections
November 19, 2024
Enhancing Your Automated Trading System: Key Insights from Best Pro Trade
November 14, 2024
NinjaTrader New Ecosystem Tools: October 2024 Edition
Enter Email for Updates