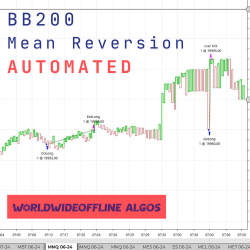
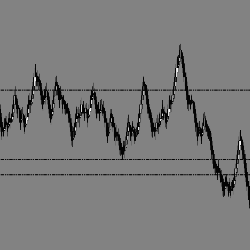
The original BB200 mean reversion strategy is designed for NQ/MNQ, on their specific Kagi set charts. BB200 can be deployed on any pair of your choice, not just NQ/MNQ. Backtesting is suggested before use. They like to run the strategy on ES/MES, as well. BB200 utilizes a trend filter.
Trading OrderFlow delivers your ideas: your imagined automated strategy, semi-automated strategy or custom indicator. Turn your concept into an elegant solution adapted to your trading style and needs. Contact them about your development project for specialized service and expertise!
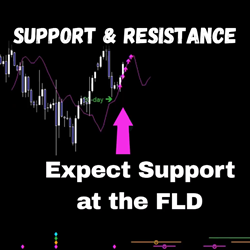
Perform an expert Hurst cycle analysis on any instrument/timeframe chart, and gain insight into hidden levels of support & resistance with accurate targets. Interactions between price & the Future Line of Demarcation (FLD) are identified for you, enabling anticipation of price action ahead of time.
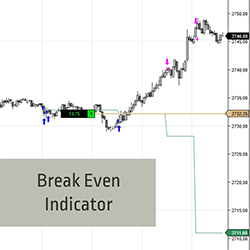
Want to hold on to trades longer? The Break Even indicator calculates profits taken into the average price of the remaining position. See the Break Even line move away from price & gain additional confidence to remain in your trade! It works for both long & short trades. Start your 2-week trial now!
EPyFClimaxVolume is an indicator which designates climax areas within intraday charts. It also identifies important entry & target levels for day trading. You can customize the indicator levels within each chart.
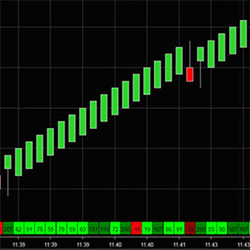
Market Delta Volume Profile is designed to distinguish if buyers or sellers are in control & to see breakdown of volume in each bar. It’s used to identify price reversal areas and look into the price action of each Renko bar to view volume profile, price & monitor order flow.
Learn from a certified Mental Performance Coach and Veteran Trader! Discover how to control that voice inside of you that causes you to chase trades, enter too early, revenge trade, fear of missing out (FOMO), over trade, under trade, and blow accounts. And the list goes on...
Earl's ultra-configurable HAMA indicator not only smooths out price data, but it excels at helping you spot divergences and leading momentum swings with an "RSI Filter" setting. Trade with more confidence and less hesitation with the included Trend Trigger indicator to help time your entries.
Price Action Harvester™ scans all markets to find consistent price action patterns based on historical data. Know how price moved for any instrument on particular days, during particular time-frames. A powerful tool for day traders. Don't miss this indicator!
This fully-automated trading strategy from Indicatortrader works on both NinjaTrader 7 & 8. It can operate 24 hours a day can be implemented in equity, futures and forex markets. Use this strategy to backtest years of historical data to find the best possible trading hours.
December 2, 2024
Mastering Sideways Markets With Auction Bars and Range Projections
November 19, 2024
Enhancing Your Automated Trading System: Key Insights from Best Pro Trade
November 14, 2024
NinjaTrader New Ecosystem Tools: October 2024 Edition
Enter Email for Updates