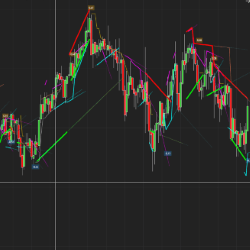
Trendlines can be drawn in so many incorrect ways. Drawing it incorrectly can make most trades losers and vice versa. Getting it right makes all the difference! QTL has a faster and far more accurate approach. Ready to automatically find the most accurate trendlines?
Time Or Range is a custom bar type with intervals at a predetermined elapsed time span OR price action range.
This fully-automated trading strategy from Indicatortrader works on both NinjaTrader 7 & 8. It can operate 24 hours a day can be implemented in equity, futures and forex markets. Use this strategy to backtest years of historical data to find the best possible trading hours.
This is the ultimate mean Renko version (with wicks) for NinjaTrader 8. It removes noise and helps visualize trends. ninZaRenko can be used for charting, trading, backtesting, and programming. It is trusted and loved by thousands of traders worldwide. Download free now!
Get all of the most critical indicators in one package. Market Levels provides VWAP, Value Area High/Low, Point of Control, Initial Balance, Open, High, Low, Close and more helping you identify key price areas. Levels are plotted for the full session and a user customized session.
Live trading room for ES S&P 500 day traders. Based on Rose’s Fibonacci trading system, charts are posted and price action shared. Previous trades are reviewed so that students can improve. Discord chat room goals: help students become independent traders & provide a supportive community.
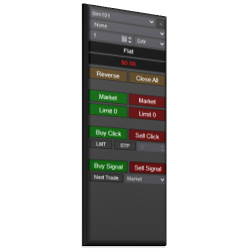
The Signal Entry Orders indicator allows traders to click a button that initiates logic to submit orders immediately on the close of a bar, as soon as a signal occurs. This removes unnecessary stress and challenge when entering orders.
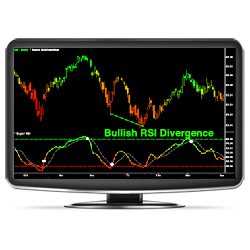
The Super RSI™ Indicator Package overcomes the limitations of the tradational RSI & offers several powerful new features making it more effective than ever before! Upgrade to a smoother RSI that utilizes the state-of-the-art "Divergence Engine" and Dynamic Overbought/Oversold Levels!
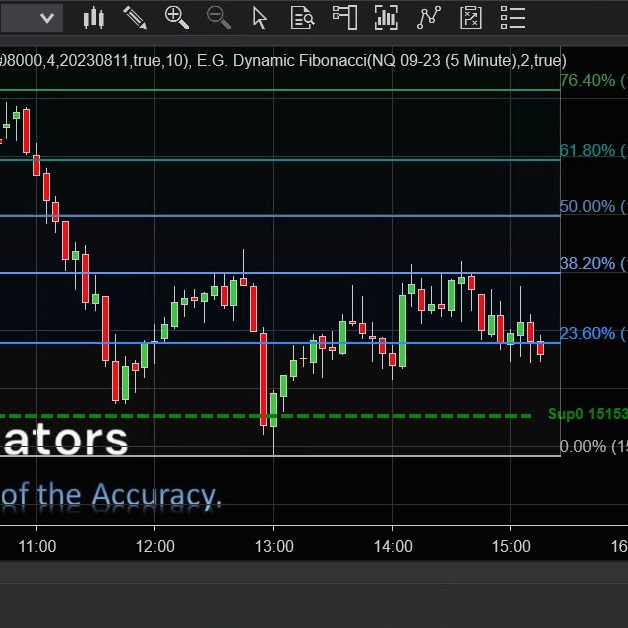
The E.G. Dynamic Fibonacci is an innovation developed by the scientists of E.G. Indicators; dynamically moves to indicate profit targets and another confirmation for the E.G. Trigger Point.
Daily trade strategy briefing (S&P 500 e-mini (ES) and Nasdaq 100 (NQ) futures). Two-week free trial. This daily email report is published "pre-RTH" session so traders can be prepared and have an actionable trade strategy plan with relevant probability price targets for the current session.
December 2, 2024
Mastering Sideways Markets With Auction Bars and Range Projections
November 19, 2024
Enhancing Your Automated Trading System: Key Insights from Best Pro Trade
November 14, 2024
NinjaTrader New Ecosystem Tools: October 2024 Edition
Enter Email for Updates