If you've never considered support and resistance from the perspective of volume – think again. Light volume regions indicate price action passing through and a great signal for continuation of trend. High volume suggests a pause point. Just what you need to know in advance. So, grab yours now!
Track NYSE and NASDAQ market breadth divergence directly from your price chart - even on Renko bars! Optimal Breadth seamlessly integrates advance-decline internals with your price chart and plots three intraday divergence types: classic, hidden and micro. Never miss a signal again!
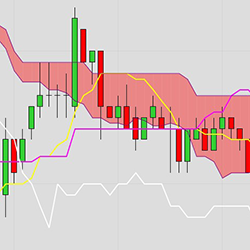
Free Ichimoku Cloud Indicator for NinjaTrader 8! This indicator can be used for both discretionary trading or as part of a NinjaScript based strategy. Download it today!
The Angels and Demons Indicator shows current and past support and resistance levels. It can be applied to multiple time frames, making it suitable for swing and position traders as well as day traders. Easily visualize important price levels where longs and shorts attempt their defense!
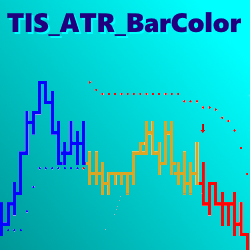
The ATR_BarColor Setup is the evolution of Supertrend; it adds a 3rd state ( Trending Up, Trending Down and Non-Trending ) that helps to avoid sideways market conditions. Bars are colored for quick condition identification.
The Arnaud Legoux Moving Average (ALMA) is a powerful technical indicator designed to improve the accuracy of moving average calculations. ALMA indicator is an advanced variation of traditional moving averages that aims to reduce lag and noise while providing better responsiveness to market changes.
We have added two new products for market analyzer. One works in conjunction with DualTrend 2.0 to keep you aware what market is trending so you can trade with the trend. The other works with CB ZoneChart V5. It will let you know if your market is in the lower zone or Upper Zone.
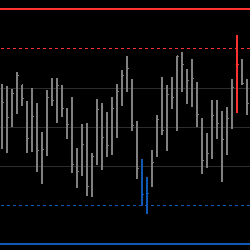
The Value Chart Indicator draws bars over a dynamically created scale from the last highest to the lowest values over a period. It attempts to spot market oversold and overbought areas on a short time scale, when price is most probable to revert to its mean.
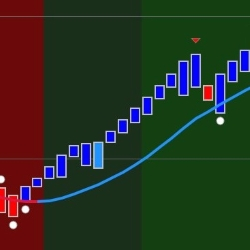
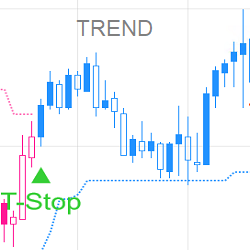
This strategy is a trailing stop indicator turned into a fully automated strategy on "autopilot" that manages trades from open to close. Follow the trend on any time frame of your choice - available as lifetime purchase or monthly lease.
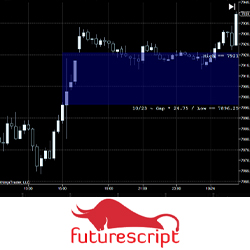
The Gap indicator was designed to illustrate when dramatic price disconnects from one period to the next when the market establishes critical levels. This indicator has been carefully constructed to explore different perspectives and trading approaches related to the gap in intuitive ways.
December 2, 2024
Mastering Sideways Markets With Auction Bars and Range Projections
November 19, 2024
Enhancing Your Automated Trading System: Key Insights from Best Pro Trade
November 14, 2024
NinjaTrader New Ecosystem Tools: October 2024 Edition
Enter Email for Updates