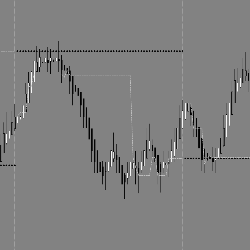
EPyFVPOC is an indicator which displays in real-time the most traded price of the current day, as well as for any previous days loaded in your chart. It also indicates the Point of Control for the previous session, an important level for intraday traders.
This ultimate package provides high-quality, reliable signals with quick, easy, and precise order entry. Agile Piranha Scalping generates rapid, high-frequency signals, swiftly executed within a small market range. It elevate your scalping with efficiency and reliability.
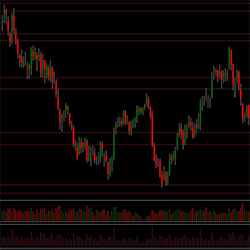
Your success as a forex trader depends on the ability to identify when a currency is overbought or oversold. The currency strength indicator does just that, revealing strength and weakness in all timeframes from scalping to trend trading, instantly, simply and clearly – so grab yours now.
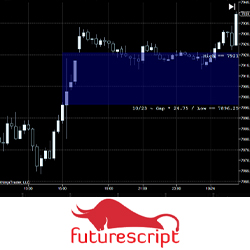
The Gap indicator was designed to illustrate when dramatic price disconnects from one period to the next when the market establishes critical levels. This indicator has been carefully constructed to explore different perspectives and trading approaches related to the gap in intuitive ways.
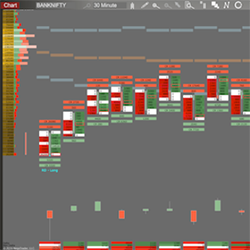
Helping people to see beyond the price action – to see how market participant and their effort on the candlestick. Market participant like market buyers and sellers, and their effect on limit buyers and sellers by combining foot print chart and market profile.
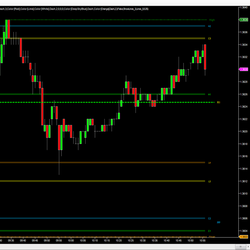
The DTB Trading Lines indicator conveniently plots (1) Standard pivot points (2) Last 5 days highs, lows, and closes, (3) Todays open price (4) High and low of current day.
Whether you are an absolute beginner, or an advanced trader, this course if for you. The Professional Trading Course is a comprehensive training program or serious traders consisting of 22 video lessons, a robust trading system plus ongoing support.
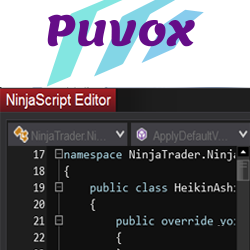
According to your technical plan, Advanced Software Features will implement a trading idea or an indicator idea using the C# computer code and the NinjaTrader 8 terminal. With the help of additional mathematical libraries, they will be able to develop complex trading algorithms with you.
Bell R-Delta Alert provides a 360 degree microscopic view of the markets and is particularly designed for Scalpers, Intraday and short term players. The Bell R-Delta features onscreen, audio and email alerts!
We provide programming services for NinjaTrader customers including indicators, addons, strategies and more.
December 2, 2024
Mastering Sideways Markets With Auction Bars and Range Projections
November 19, 2024
Enhancing Your Automated Trading System: Key Insights from Best Pro Trade
November 14, 2024
NinjaTrader New Ecosystem Tools: October 2024 Edition
Enter Email for Updates