Trade your own capital with consistency. Follow your own plan from day one. Develop and demonstrate your trading skills. Pass qualification to get a Master Account. Show results and get your first $10k withdrawal commission-free. Invest in yourself. It's time to catch a wave!
A precise analytical tool derived from statistical trading metrics such as prices and volume, offering insights to inform trading decisions.
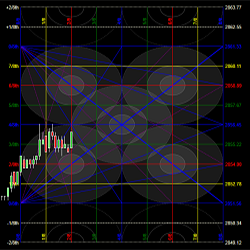
Samri Math RY Intraday is a purely PRICE-based indicator for traders who use Murrey Math methodologies. It works not just with time-based charts (day/minute/second), but also with other chart types such as Renko, Range, Volume and Tick. Multiple algorithms for calculating price levels are included.
The Wavy Tunnel PRO ELITE Scanner Tools and Market Analyzer simplify finding trades. Set chart alerts for easy monitoring. The ELITE Tools save time by highlighting trades with visually appealing setups in line with the market cycles. Good for momentum, day and swing trading on all asset classes.
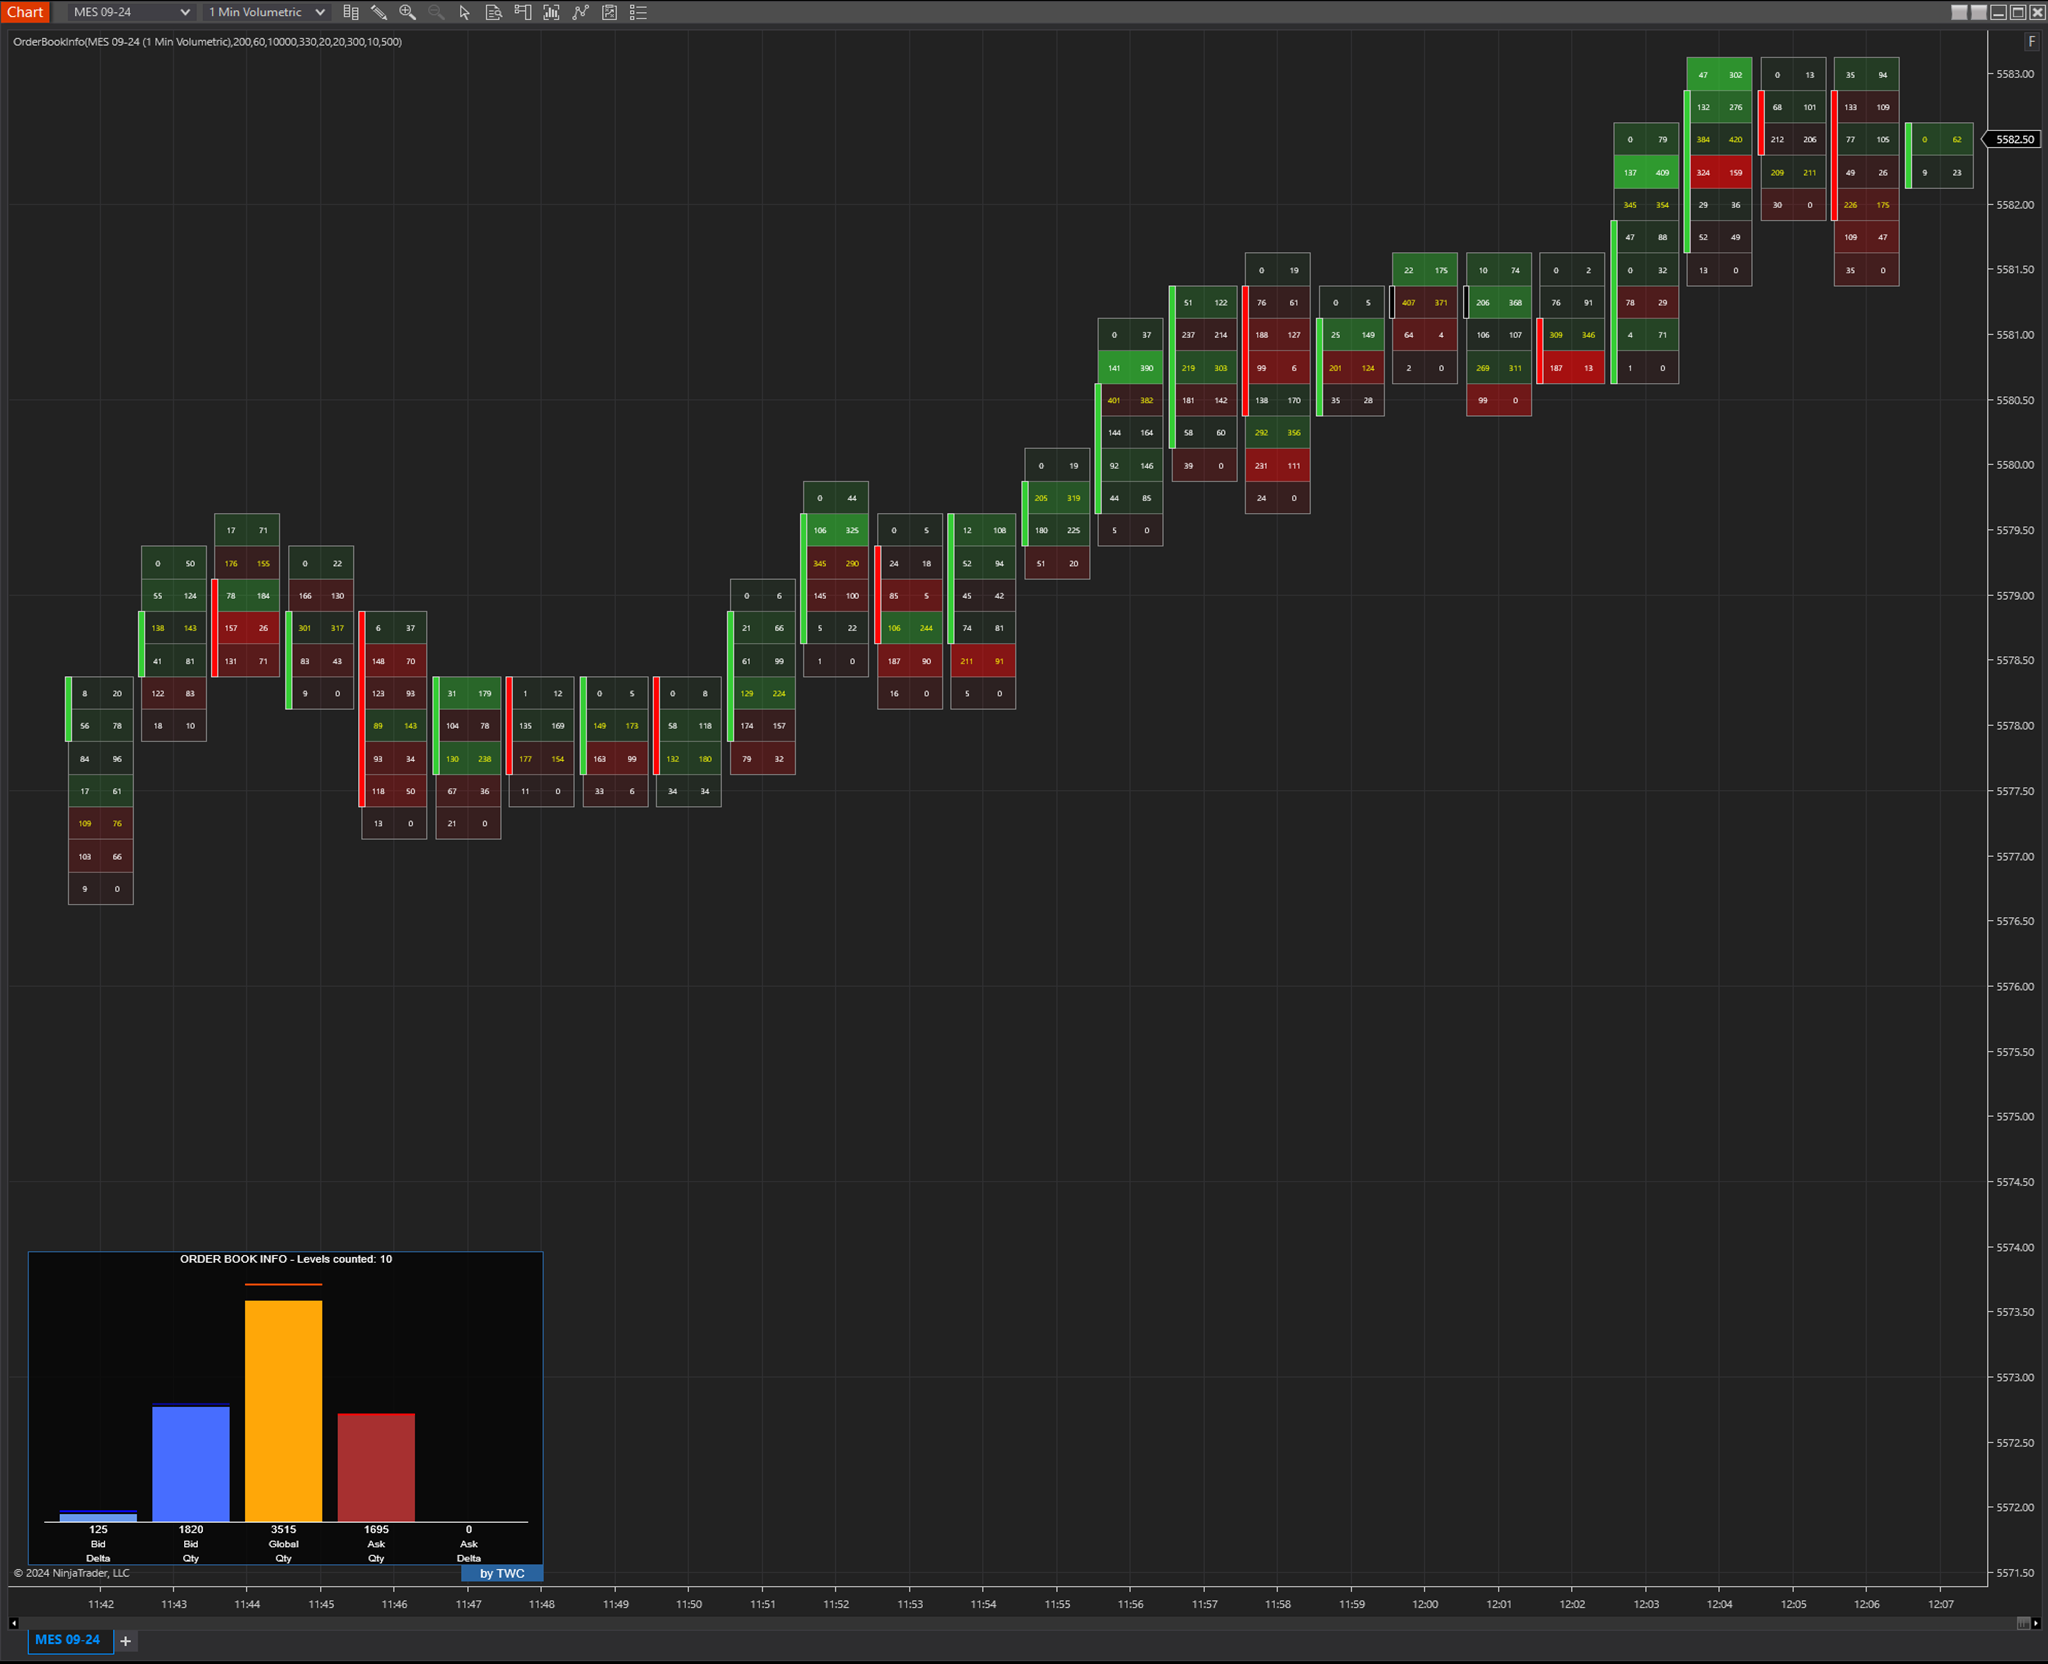
TWC Order Book Info graphically displays the number of orders in a Depth of Market (DOM). This widget shows the total number of orders, buy orders, sell orders, and the delta between them.
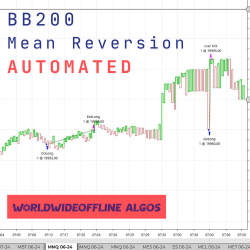
The original BB200 mean reversion strategy is designed for NQ/MNQ, on their specific Kagi set charts. BB200 can be deployed on any pair of your choice, not just NQ/MNQ. Backtesting is suggested before use. They like to run the strategy on ES/MES, as well. BB200 utilizes a trend filter.
The Lighthouse Trading strategy works fully automatically in the futures market. The algorithm analyses time and sales, volume, rhythm and acceleration in real time. Its objective is to search for patterns to help determine who controls the market.
Our advanced automated trading system is specifically designed for futures scalping. By analyzing price action, volume and Fibonacci levels, our system takes the emotion out of trading and executes precise trades with lightning-fast speed. Get an edge in the markets and let our system work for you.
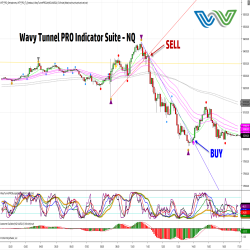
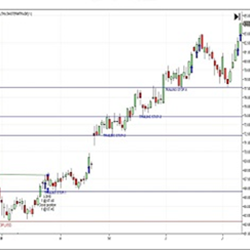
An intraday, swing or long-term trend trading indicator package that can be traded on any timeframe. Long and short arrows are generated designating entry/exit points, and trailing stops are easily identifiable based on support and resistance levels. Learn more!
This trading masterclass delivers all the fundamental knowledge and trading skills as the foundations on which to develop your trading career for financial, commodity and digital asset classes. Up to one year to complete. Includes a free trading challenge to qualify for a funded trading account.
December 2, 2024
Mastering Sideways Markets With Auction Bars and Range Projections
November 19, 2024
Enhancing Your Automated Trading System: Key Insights from Best Pro Trade
November 14, 2024
NinjaTrader New Ecosystem Tools: October 2024 Edition
Enter Email for Updates