TD’s Flexible Volume Profile helps to reveal institutional trading activity and identifies the strongest support and resistance zones. The use of tick volume data makes it extremely precise, pointing to potential entries. It is easy to learn and simple to use.
The Smart Momentum NinjaTrader Indicator tool has a unique design compared to other momentum indicators. It uses an averaging mechanism that analyzes the cycle and adapts to it. This results in a momentum plot that is simultaneously smooth and sensitive.
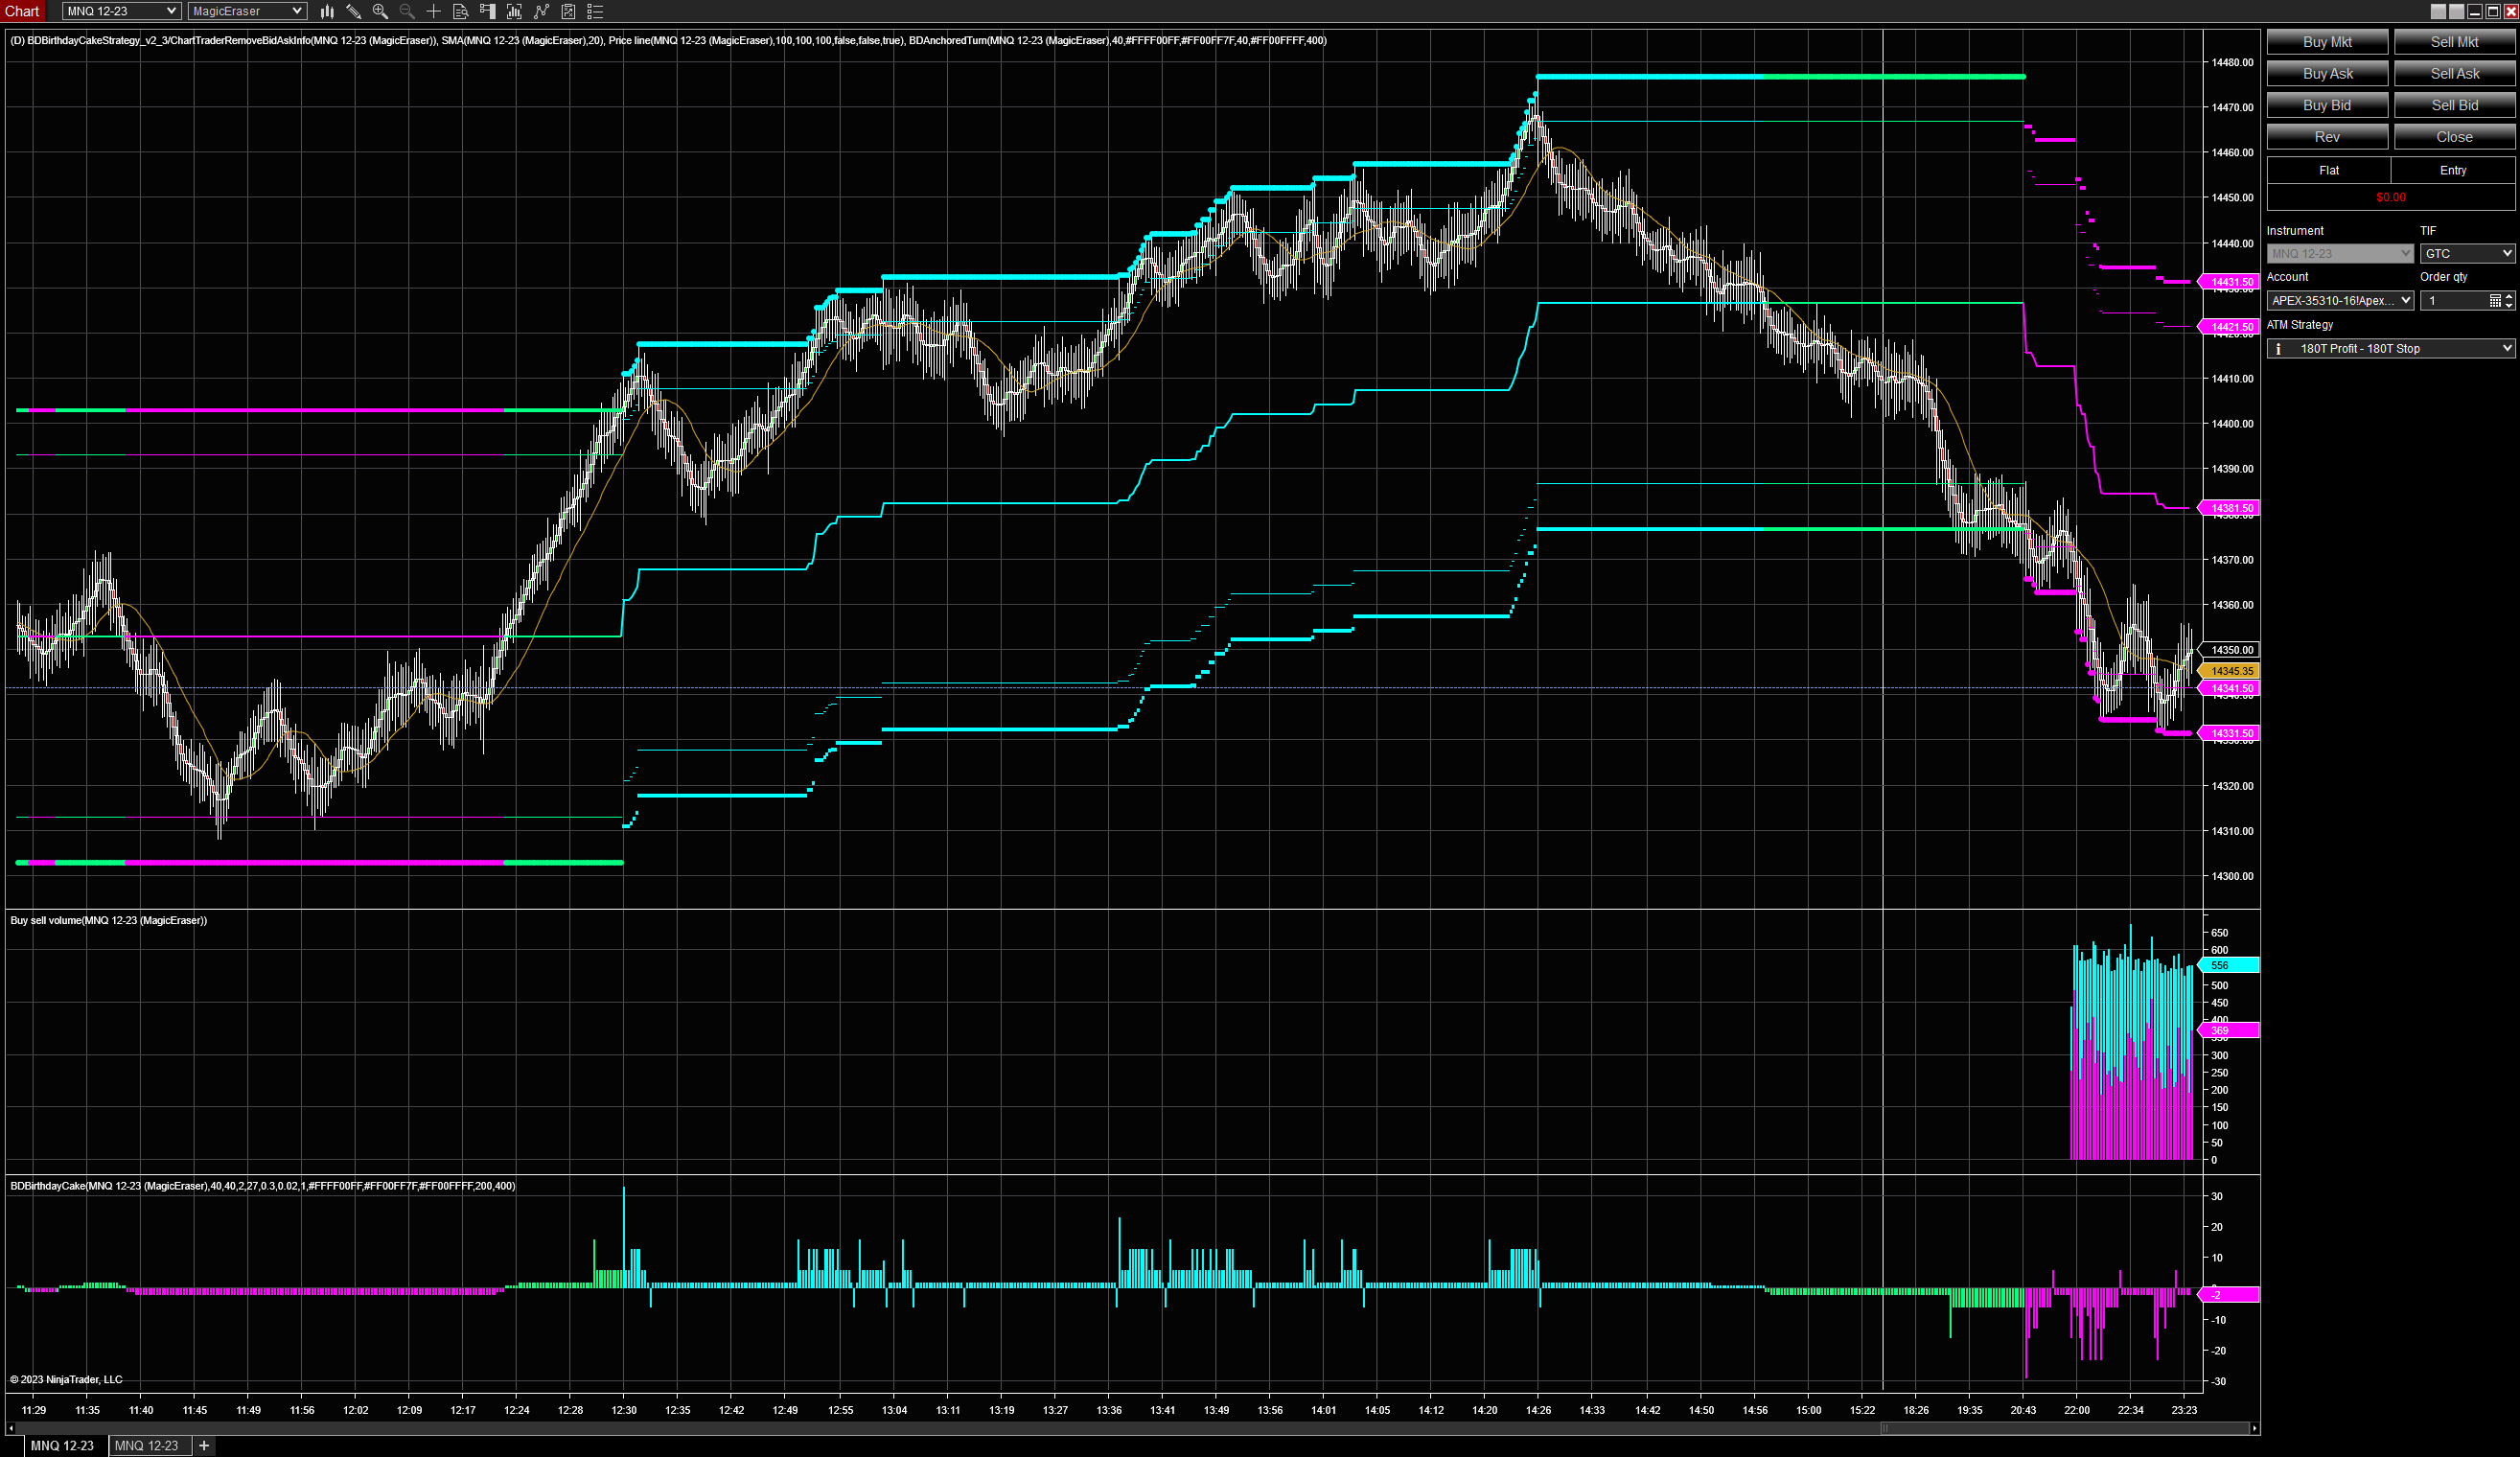
This anchored turn indicator makes it easier to identify the current trend for intraday trading, and provides multiple areas for precise entries. They use it internally for all of their trend based strategies and have been working on new scalping strategies, as well.
EPyFClimaxVolume is an indicator which designates climax areas within intraday charts. It also identifies important entry & target levels for day trading. You can customize the indicator levels within each chart.
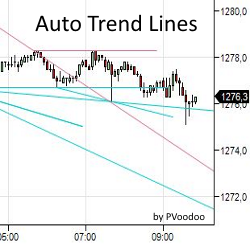
The PVAutoTrendLines allows traders to see lines within market highs and lows and automatically extrapolate the data into support and resistance levels. Traders can use this data for entry/exit signals or within automated strategies. Learn more!
Patternsmart custom programming services aim to provide fast and efficient solutions to all customer requests. Primary services include custom alerts, automated, trading, SuperDOM and Market Analyzer columns, indicators & more. All custom scrips include a free 1-year bug fixing service!
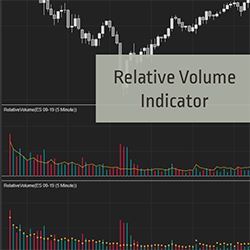
Detect unusual or below average volume easily. Identify the start or end of a move with no effort. Relative Volume (RVOL) compares current volume to the average volume for the same time of day. Start your 2-week trial now!
Education that includes beginner, candlestick analysis, how to place a trade, stair stepping, Fibonacci retracements, Fibonacci extensions and more.
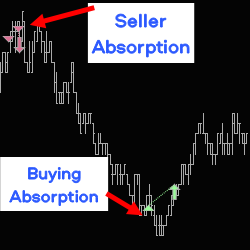
Absorptions are announced in real time with audible alerts and/or drawings on the chart. It also analyses backticking following absorptions. Adapt your trading zone live, with a toolbar on the chart. Strategy builder compatible.
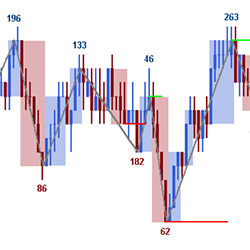
The MAutoFloorCeiling indicator is the culmination of over 2 years of research to determine support / resistance levels automatically. The heart of it utilizes a powerful algorithm based on Wyckoffian concepts of waves, volume, and price levels to gain insight on potential entry points.
December 2, 2024
Mastering Sideways Markets With Auction Bars and Range Projections
November 19, 2024
Enhancing Your Automated Trading System: Key Insights from Best Pro Trade
November 14, 2024
NinjaTrader New Ecosystem Tools: October 2024 Edition
Enter Email for Updates