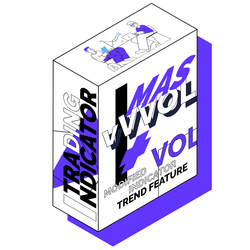
The LogikDynamicRange is a unique Range Bar with Dynamic Resizing capabilities. This is done by employing a non-lag range determination technique, continuously adapting the bar size throughout the day, capturing trends while displaying consolidation areas very easily.
Maximize your trading prowess with the Dark Diamond Trend Sniper for NinjaTrader 8. Harness distinct buy/sell signals, real-time audio alerts and automatic support and resistance detection. Works with various bar types, including Orenko and Heikin Ashi. Try it free for 7 days.
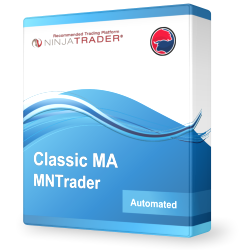
Classic MA MNTrader is a fully automated trading system. Trading is based on the moving averages indicator for two classic signals on our developed system of support positions with flexible settings. Suitable for all futures and Forex trading instruments.
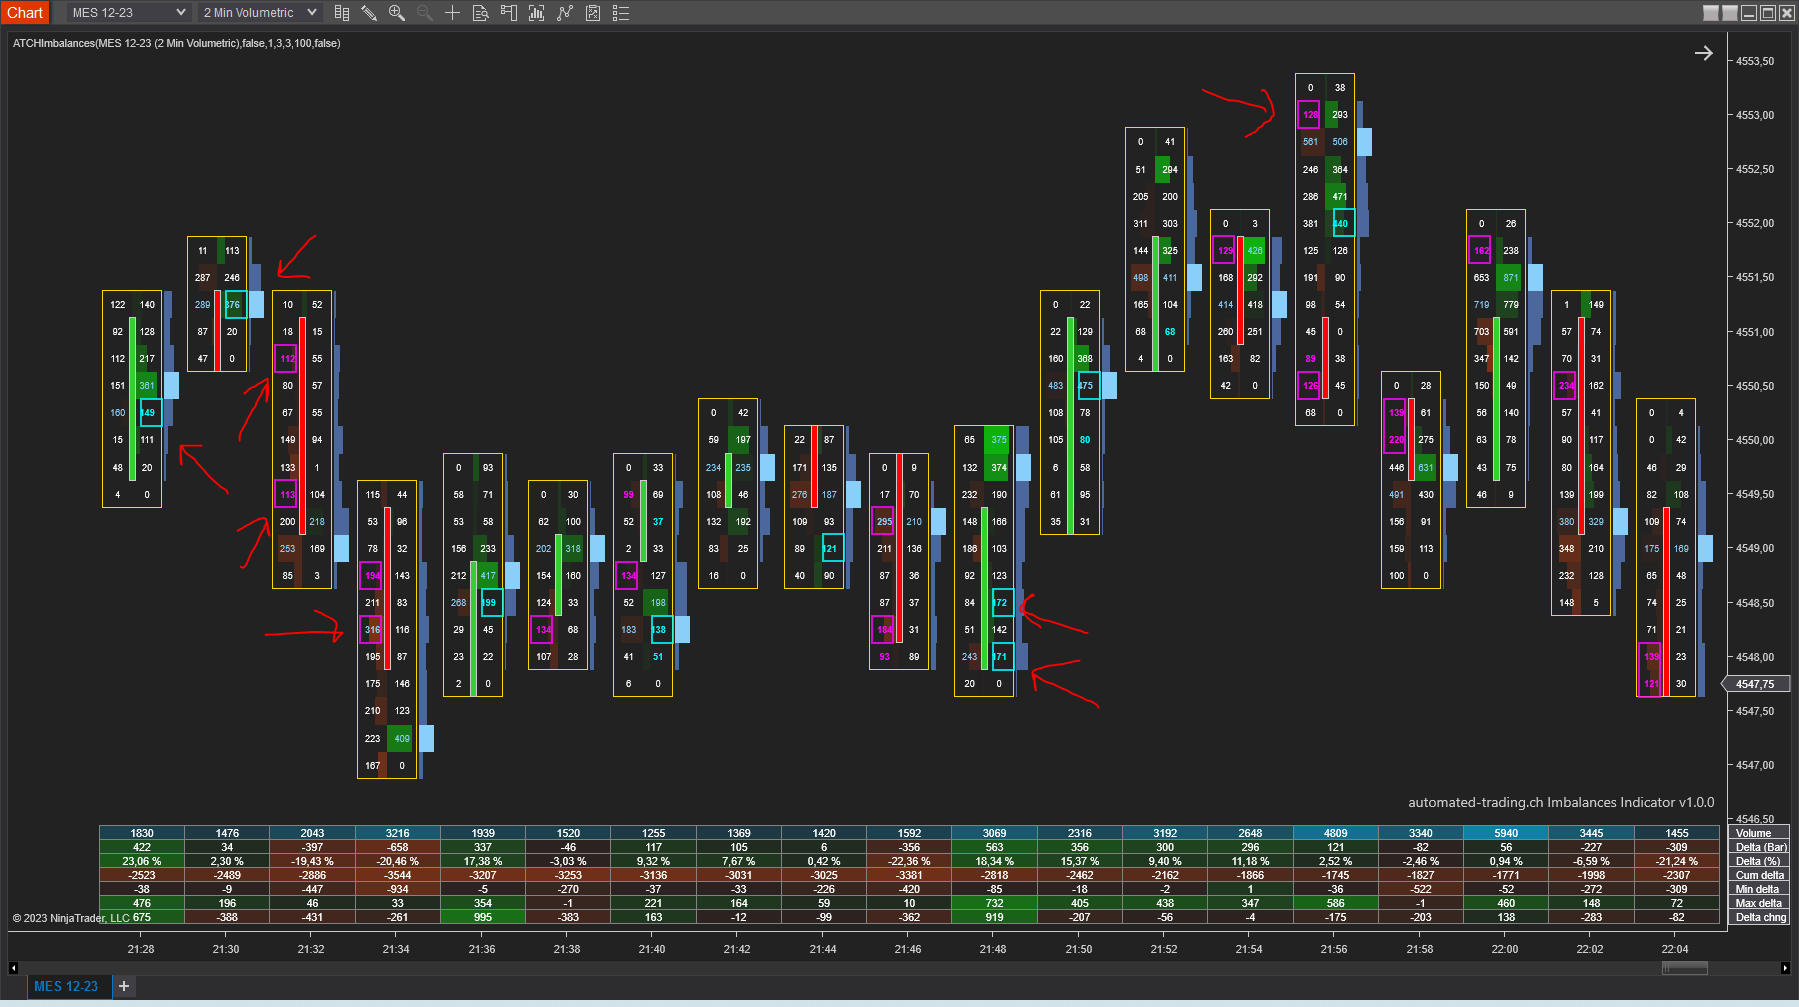
Volume imbalances is a free NinjaTrader 8 indicator that highlights diagonal volume imbalances on both footprint charts and regular candlestick charts. Imbalances occurs on price levels where trade volume on one side (bid/ask) is excess over the trade volume on the opposite side.
Innovative Trading Solutions has been building indicators, fully-automated or ATM Strategies, chart types, and chart styles to client specifications for over 8 years. They also offer NinjaTrader 7 to NinjaTrader 8 conversion services. Get a free quote for your project today!
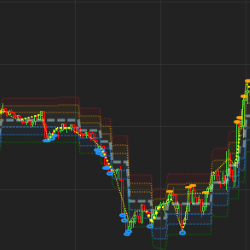
These are some free indicators that can help you gain an easier and more informed understanding of your trades. Risk calculator, easy entry, volume bar and trend indicators all may help you to avoid mistakes.
The E.G. Academy Program offers various educational services and tools; customers purchasing the E.G. Trigger Point (annual plan) enjoy the E.G. Futures Trading Course lifetime access for free, and a free trial for the E.G. Price Action Bot.
This indicator tracks the Smart Money flow in the market. Following the Smart Money provides a better understanding of the volatility size and trend direction. Ready to see what the Smart Money is doing?
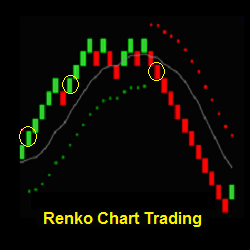
Renko Chart Trading offers day trading strategies, indicators and a training program focused on Renko charts. Learn the characteristics of how Renko charts can emphasize price, help filter chart noise and add clarity to trading. Join the Renko Trading Group today!
Get precious info to start your trading week! Focused 100% in E-mini S&P500 Futures and based in a mix of technical analysis with order flow tools, the newsletter presents possible trading scenarios for the week, highlighting important regions. Sign up now for FREE!
December 2, 2024
Mastering Sideways Markets With Auction Bars and Range Projections
November 19, 2024
Enhancing Your Automated Trading System: Key Insights from Best Pro Trade
November 14, 2024
NinjaTrader New Ecosystem Tools: October 2024 Edition
Enter Email for Updates