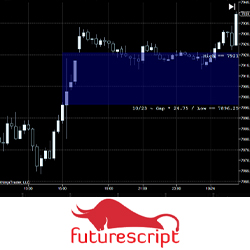
The Gap indicator was designed to illustrate when dramatic price disconnects from one period to the next when the market establishes critical levels. This indicator has been carefully constructed to explore different perspectives and trading approaches related to the gap in intuitive ways.
OTM Volume Profile is essential to understand the auction behavior and find key price reaction zones, such as the VPO, high and low value area. This profile preserves and allows to visualize these levels historically, which distinguishes it from static profiles.
edgeful breaks down market data into easy to read reports that instantly show you how any asset behaves, down to a specific weekday. They have all the breakdowns to tell traders when to size into a trade, when to size down, and even where to set your profit targets, based on the data, not opinions."
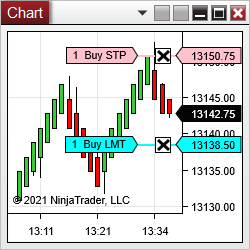
Clicker allows one to enter orders with one click directly on the chart! Modifier keys and mouse buttons for buying and selling are configurable. The order type is detected from the clicked price relative to the market price. All order parameters come from ChartTrader. Free trial for seven days.
A unique course with a specific, rule-based & mechanical/objective trading methodology. Designed to help traders identify entries & exits, define size, manage risk and control emotions when trading Equity Markets with their own characteristics & terminology. Get FREE access to the patented AutoUFOs®
The Quantum Dynamic Volatility indicator paints volatility as price action unfolds - no more guesswork, no more nasty shocks. Watch and wait, then trade with this safety-first indicator!
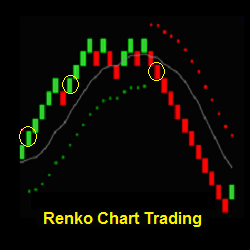
Renko Chart Trading offers day trading strategies, indicators and a training program focused on Renko charts. Learn the characteristics of how Renko charts can emphasize price, help filter chart noise and add clarity to trading. Join the Renko Trading Group today!
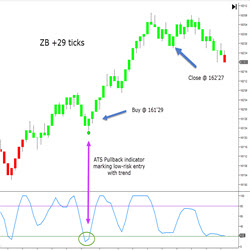
The TrendContinuation indicator identifies and alerts the trader of high probability continuation trades in the direction of the major trend. Using a time tested algorithm for determining possible low risk entries, this indicator marks the location and can notify the trader via email or text.
Activity Bars is a unique bar type for NinjaTrader which accounts for every single trading activity. Activity Bars establish both nature price action and trend. They work well in choppy markets by accumulating trading activities of ranges and zones, but also work for trending markets.
The IABands are envelopes similar in concept to the popular Bollinger Bands, only far more responsive. The direction and the width of the IABands gives an idea of when a financial instrument is trending versus not trending. The value of any band will very often turn out to be a strong reversal area.
December 2, 2024
Mastering Sideways Markets With Auction Bars and Range Projections
November 19, 2024
Enhancing Your Automated Trading System: Key Insights from Best Pro Trade
November 14, 2024
NinjaTrader New Ecosystem Tools: October 2024 Edition
Enter Email for Updates