SniperTrader is a fully automated trading system that can reduce or completely remove the stress of day-to-day trading. It helps advanced or beginner traders with an easy plug-and-play function to set up and operate.
Download this free indicator that allows you to trade directly on your chart. You no longer need to use buttons to enter the market. With this indicator, you can select your entry point directly on the chart. Quickly place limit orders with a single click of the mouse (no need to right-click).
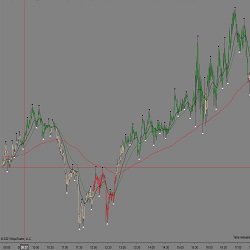
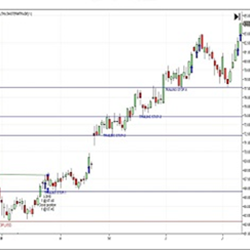
Trend Friend is a simple indicator designed to identify when the price in different time periods is aligned with select moving averages. It is not a closed methodology to operate but you can establish two systems to use this indicator: aggressive operation to paint signals or wait for a retracement.
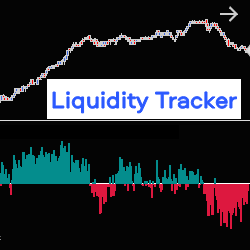
The Liquidity Tracker allows you to monitor, in real time, liquidity variations in the Order Book (pending orders at Bid & Ask), on one or two correlated instruments, at the same time. It therefore allows you to follow the evolution of the market based on the strength of supply or demand.
You can now calculate how liquid a symbol is based on its trading activity and filter out risky instruments. A higher no of trades a day would mean that the instrument is drawing attention. Start using this powerful screener tool in your market analyzer today!
TradeSafe is a Boolean-logic, rules-based mechanical day trading system that automatically determines strength of trend and optimum exit strategy and plays audible spoken alerts. Nearly 100% automated, it uses benchmarking for consistency. Watch replay: https://daytradesafe.com/replay/
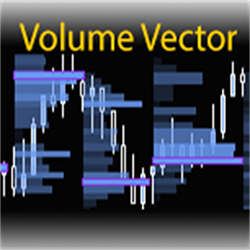
The Volume Vector tool creates automatic volume profiling of price action swings. Increase trading consistency and see exactly where trades have been initiated!
Larry Cheung’s investment community provides investment research regarding U.S and Chinese macroeconomics and company-specific fundamental analysis. He also uses technical analysis and order flow to best understand risk/reward for entries and exits across different timeframes.
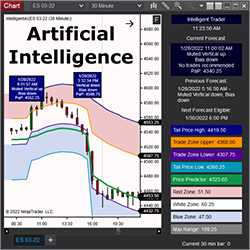
Intelligent AI uses a proprietary AIFS platform (Artificial Intelligence Forecast System). AIFS models are trained to learn the underlying structure of the market to forecast what may happen over the next six hours. Subscriptions also include access to Intelligent Trader's moderated Discord channel.
An intraday, swing or long-term trend trading indicator package that can be traded on any timeframe. Long and short arrows are generated designating entry/exit points, and trailing stops are easily identifiable based on support and resistance levels. Learn more!
December 2, 2024
Mastering Sideways Markets With Auction Bars and Range Projections
November 19, 2024
Enhancing Your Automated Trading System: Key Insights from Best Pro Trade
November 14, 2024
NinjaTrader New Ecosystem Tools: October 2024 Edition
Enter Email for Updates