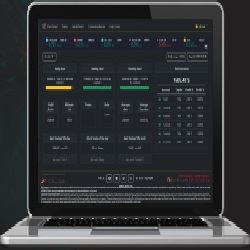
The best risk management dashboard tool, with an intuitive web platform that provides complete control, protection & detailed visualization of the evolution of all trading accounts. Optimized for propfirm trading, our solution is the ultimate choice for traders and teams. Click to learn more!
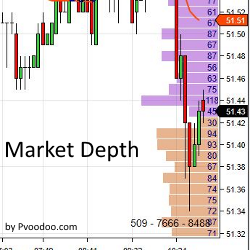
The addition of Market Depth indicators allow traders to see the bid/ask data based on price in real time. Similar to the Level II data featured in the NinjaTrader SuperDOM, the Market Depth Indicator plots bid/ask data directly on a chart. Learn more!
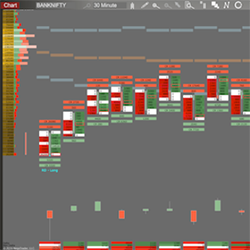
Bell R-Delta Alert provides a 360 degree microscopic view of the markets and is particularly designed for Scalpers, Intraday and short term players. The Bell R-Delta features onscreen, audio and email alerts!
Discover top trading opportunities for US stocks, Wyckoff method analysis in US indices futures, Gold, Silver, market internals, and more to look for “time sensitive development” trading opportunities. Discuss your trading plans and past trade reviews to sharpen your price action trading skills.
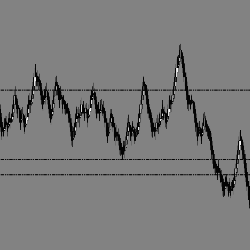
EPyFClimaxVolume is an indicator which designates climax areas within intraday charts. It also identifies important entry & target levels for day trading. You can customize the indicator levels within each chart.
Trading coach with volume and price indicators.
The BG Levels indicator displays institutional buy and sell levels - where the “smart money” is buying and selling - and where they are exiting. The premise is to buy at a cross of the Level Up line (to the upside) and exit your long position at the Target line (to the downside).
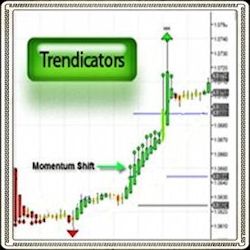
The Trendcators Indicator suite is designed to unclutter the market via built in analysis tools to pinpoint entry/exit signals with ease. It’s fully customizable providing you with the flexibility to determine which aspects of technical analysis are important for your trading! Get Started Now!
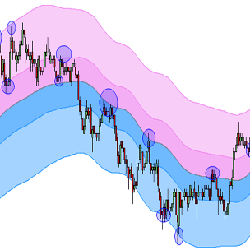
A remarkable price channel, with a proprietary formula that is adaptive to market conditions and reveals dynamic support and resistance levels. TC_NovelChannel paints two colored bands which show a consistent tendency to provide support and resistance to price, for any instrument or time-frame.
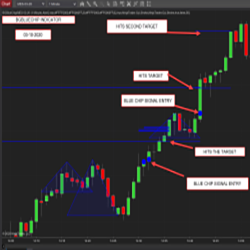
The BG BLUE CHIP clearly & accurately tells you when to enter a trade with a blue dot, and when to exit a trade with a blue horizontal line. It is that simple. The BG BLUE CHIP is one of the most popular indicators and is trusted by thousands of traders worldwide.
December 2, 2024
Mastering Sideways Markets With Auction Bars and Range Projections
November 19, 2024
Enhancing Your Automated Trading System: Key Insights from Best Pro Trade
November 14, 2024
NinjaTrader New Ecosystem Tools: October 2024 Edition
Enter Email for Updates