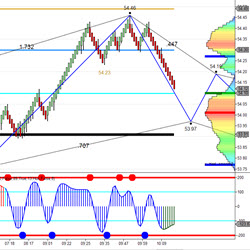
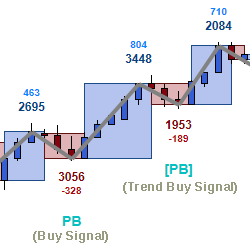
Pattern MNTrader is a fully automated trading system. Trading is conducted based on trading patterns, support and resistance lines, Fibonacci lines and trend lines. This unique combination of tools creates an innovative system of support positions with flexible settings.
Fully-automated. The VMX selects a time of day to trade during the cash session for stock index futures. This system takes advantage of the volatility created by big institutions moving asset allocations in the equity markets. All positions closed before the end of the cash session.
Polaris Trading Group provides futures day trading education that includes an Online Study Course & Live Trading Room. Trading veteran and Commodity Trading Advisor (CTA), David D Dube, provides traders specific support & resistance levels & trade setups based on Market Profile and volume analysis.
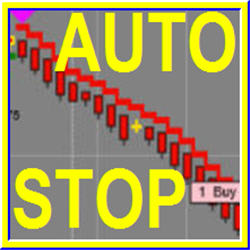
Automatic Trailing Stop works with futures, forex, stocks, ETFs. The system includes easy to use visual automatic trailing stops. It's easily adjustable for various market conditions, and works with any chart type. Get a free demo session!
Get your trade information at-a-glance. Adding the Status Box on your chart allows you to see your relevant trade stats instantly.
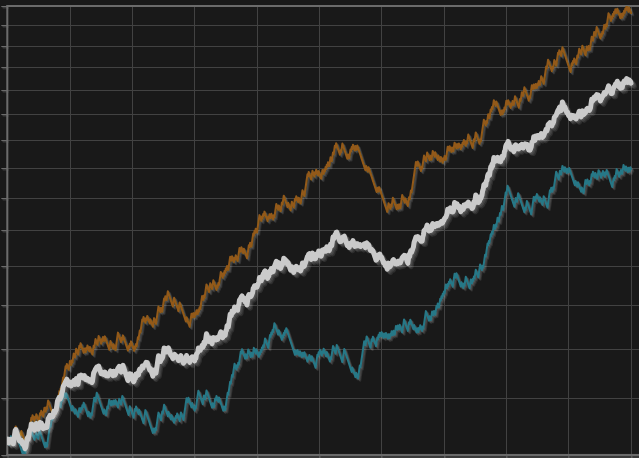
This is a trend following trading system trading simultaneously on three configurable and back testable time frames. It is aimed to be used as a CTA, trend following, multi assets trading system where the tradable assets universe is composed by futures on indices, commodities and foreign exchanges.
Unable to find your best strategy? Automation? Click here for a free 30-minute call. SET UP helps you to build your automated strategy in order to improve it on own. Book your free appointment now.
Curious about NinjaTrader 8's supplied indicators, or seeking detailed information about them? Follow this link for an in-depth exploration of each indicator, providing you with the knowledge you need for effective trading. Dive into comprehensive insights now!
Enhance your trading with our point and click Anchored VWAP indicator for NinjaTrader 8. Built as an indicator, not a drawing tool. Features unique point-and-click anchor setting with hotkeys, 3 customizable deviation bands, and 8 VWAP calculation methods. Start your free trial today!
MBoxWave Wyckoff Trading System is an order flow trading system using bid/offer and momentum to identify supply/demand imbalances. The system contains a series of indicators and signals designed to be used together to identify high probability trading opportunities, inspired by Wyckoff methodology.
December 2, 2024
Mastering Sideways Markets With Auction Bars and Range Projections
November 19, 2024
Enhancing Your Automated Trading System: Key Insights from Best Pro Trade
November 14, 2024
NinjaTrader New Ecosystem Tools: October 2024 Edition
Enter Email for Updates