Automated trading for the S&P 500, Indices, ETFs, Stocks and Cryptocurrencies. Discretionary trading indicators. The RD3 uses a two stage system for identifying profitable swing trading opportunities.
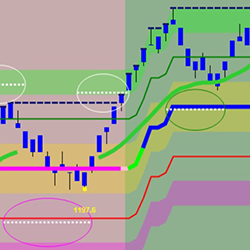
Simplify your trading with my strategy: trend, price action, support/resistance and momentum. Green/red bars indicate trend, custom ExCon indicator manages setups, pivots show support/resistance and MACD ties it all together. Clear entries, take profits and exits with simple rules for engagement.
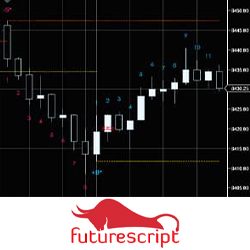
The Price Hacker introduces techniques outlined in the manual to promote the creativity of the user. The hacker section is for identifying sudden shifts in supply and demand, the staircase is used to pinpoint a break in a trend, and the sequence section evaluates the changing of the trends.
Educational program that teaches a unique blend of order flow strategies and a few proprietary concepts in a CPD-certified program.
Weekly long form insights on the markets with weekly and twice daily algorithmic levels coupled with intraday NQ, ES and CL trading journal.
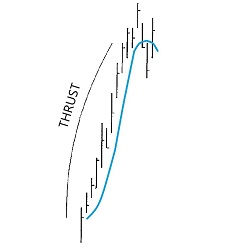
With this tool, traders can now find charts which have potential DiNapoli Directional patterns. Scan multiple markets & time frames in real time for Thrust and other patterns. Use as a chart indicator for easy recognition or as a market analyzer. Video instructions are included - try it today.
Do you want to overcome the challenges that leave traders feeling overwhelmed and uncertain? Have you tried to solve that losing pattern in your trading behavior but failed? This e-course, based on the latest neuroscience, will solve the mystery of your trading mind versus the collective market.
Identify market inefficiencies by marking fair value gaps (FVGs) on the chart that meet predefined size criteria. The indicator distinguishes between bullish and bearish gaps and changes their color once they are inversed. It provides clear visual cues for potential rejection trades from these gaps.
The Viper Indicators include long and short trade entry signals as well as a trend indicator which can be used as a trade re-entry trigger and trailing stop. After many years of development and rigorous testing in a live trading environment, this system has proved itself with traders all around the world.
NinjaCoding TPO & VolumeProfile is a multifunctional tool that plots TPO and VolumeProfiles on NinjaTrader charts. Users are presented with single or double views, value area calculations, point of control, color coding, initial balance and much more. Please explore the website for more!
December 2, 2024
Mastering Sideways Markets With Auction Bars and Range Projections
November 19, 2024
Enhancing Your Automated Trading System: Key Insights from Best Pro Trade
November 14, 2024
NinjaTrader New Ecosystem Tools: October 2024 Edition
Enter Email for Updates