This is the ultimate mean Renko version (with wicks) for NinjaTrader 8. It removes noise and helps visualize trends. ninZaRenko can be used for charting, trading, backtesting, and programming. It is trusted and loved by thousands of traders worldwide. Download free now!
The Tape Reading Crash Course is the best place to start on the path to market knowledge. The trial includes 7 days of access to the CyberGroup Live Trading Room, three daily market meetings, morning and afternoon watch-lists, weekly live Q&A sessions and hundreds of hours of recorded trading content.
The QTradez Consulting service offers guidance on the best way to create and support NinjaTrader add-on products. With over 10 years of NinjaScript development experience, QTradez consulting staff will deliver the exact information you seek as simply & cleanly as possible.
Our advanced automated trading system is specifically designed for futures scalping. By analyzing price action, volume and Fibonacci levels, our system takes the emotion out of trading and executes precise trades with lightning-fast speed. Get an edge in the markets and let our system work for you.
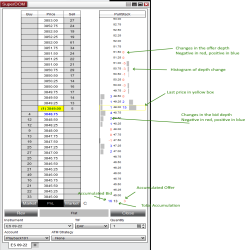
The Pull Stack Super DOM column shows you changes in the order book. There are several modes to this indicator to help give you a nuanced view and find the state of the market at each price level.
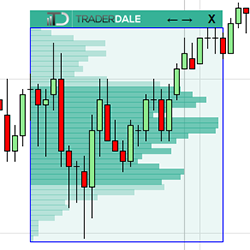
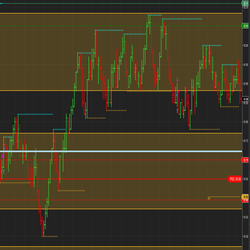
TD’s Flexible Volume Profile helps to reveal institutional trading activity and identifies the strongest support and resistance zones. The use of tick volume data makes it extremely precise leading to potential entries. It is easy to learn, simple to use, and extremely intuitive.
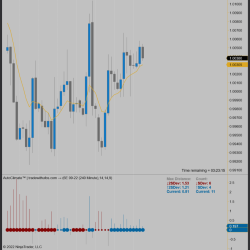
Intelligent technology assesses the market environment from a statistical point of view in order to answer the key questions before a trade: “Which side of the market should I be in?”, “Should I be a buyer or a seller?”, or “Should I simply avoid trading and not trade at all?”
Deer Creek Enterprises takes your ideas and makes them real for your trading style and needs. We have years of programming service with fast turnaround and support to our customers as well as a vast knowledge of NinjaTrader. Contact us for a free quote and get your ideas coded for trading!
YMI University is designed to pack the utmost essential content into one trading course. It's designed to give you a new level of understanding of how the stock market works, how to get started, and how you can utilize your abilities to excel and grow.
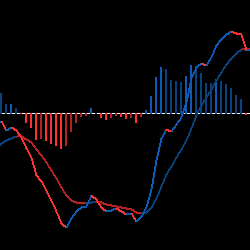
The MACD is one of the most-used indicators on the planet. This is Dynamic Trading Software’s version with built-in color coding and overlayed moving averages. Dynamic’s team says they won’t trade without this powerful classic indicator!
March 25, 2024
Trading Pullbacks and Reversals: Simplifying a Once Complex Retail Trading Strategy
March 21, 2024
VWAP Indicator: Average Price Shown Based on Price, Volume
March 18, 2024
Trade Copier Strategies: Make Efficiency Work for You When Futures Trading
Enter Email for Updates