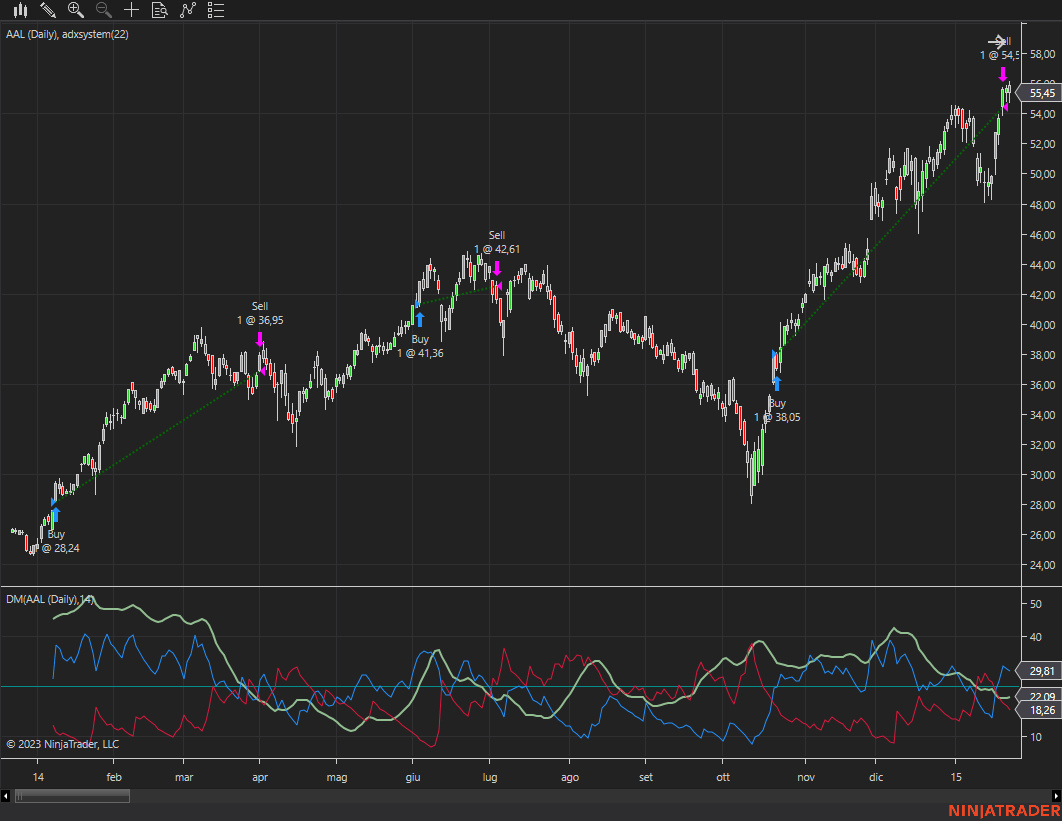
ADX trading system detecting price direction as well as trend strength.
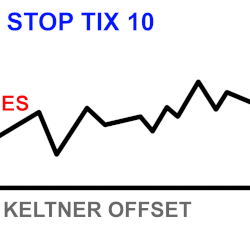
Stop Keltner uses Keltner Band distance to help give an estimated stop-loss in ticks, which is displayed in an easy-to-read text box on the chart. It’s also an excellent backtesting tool for getting estimated stops when identifying past trade entries on historical bars. Built for ES momentum traders
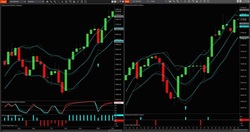
The IABands are envelopes similar in concept to the popular Bollinger Bands, only far more responsive. The direction and the width of the IABands gives an idea of when a financial instrument is trending versus not trending. The value of any band will very often turn out to be a strong reversal area.
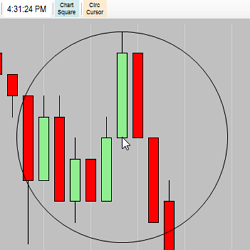
Need a quick way to measure X ticks from the cursor, for free? The IT_CircCursor is just that type of bare bones tool. Set the ticks in the parameters and click the toolbar button to activate. There are many free indicators to choose from, visit Integrity Traders today to learn more!
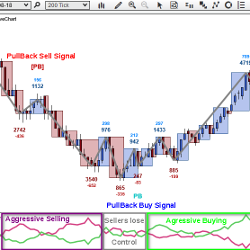
This is a YouTube channel, in which they share the precise models for smart money trading concepts. With the concepts, you can trade like the banks, by following their foot prints. With the models, you are able to see the specific footprints and in return trade like the institutions.
The Quantum Dynamic Volatility indicator paints volatility as price action unfolds - no more guesswork, no more nasty shocks. Watch and wait, then trade with this safety-first indicator!
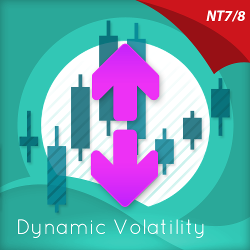
This indicator is a new approach to Price Action trading. It shows Tick Failure Breakouts above swing highs and below swing lows, which can act as support/resistance. Use the Tick Failure Breakout indicator as a discretionary indicator in your Day Trading. Get Started with a free 2-week trial today!
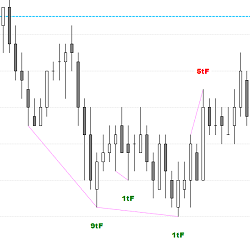
The MBidAskOscillator separates volume into trades executed at the best bid price, and trades executed at the best ask price. This indicator gives traders insight into market action, because evidence of aggressive selling or buying is clearly represented.
Learn how Volume Profile works and use it to track big financial institutions who move and manipulate the markets. Learn my most favorite Volume Profile trading strategies. This book is written in poignant way with many illustrations and real trade examples.
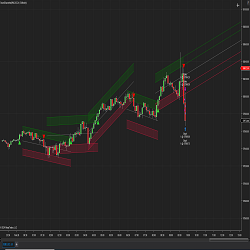
Channel levels are defined based on high and low prices influenced by candlestick bodies. These points are calculated based on the defined channel levels and look back periods. Delta values are computed to determine the channel's upward or downward slope.
December 2, 2024
Mastering Sideways Markets With Auction Bars and Range Projections
November 19, 2024
Enhancing Your Automated Trading System: Key Insights from Best Pro Trade
November 14, 2024
NinjaTrader New Ecosystem Tools: October 2024 Edition
Enter Email for Updates