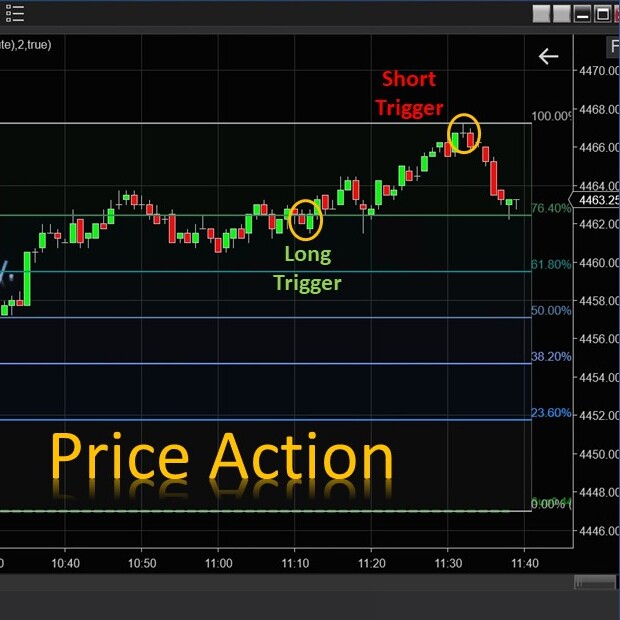
The E.G. Price Action is automatically integrated with the E.G. Trigger Point presented on your chart to generate short and long signals for you. It recognizes Price Action opportunities and generates arrows presented on your chart and sound notifications.
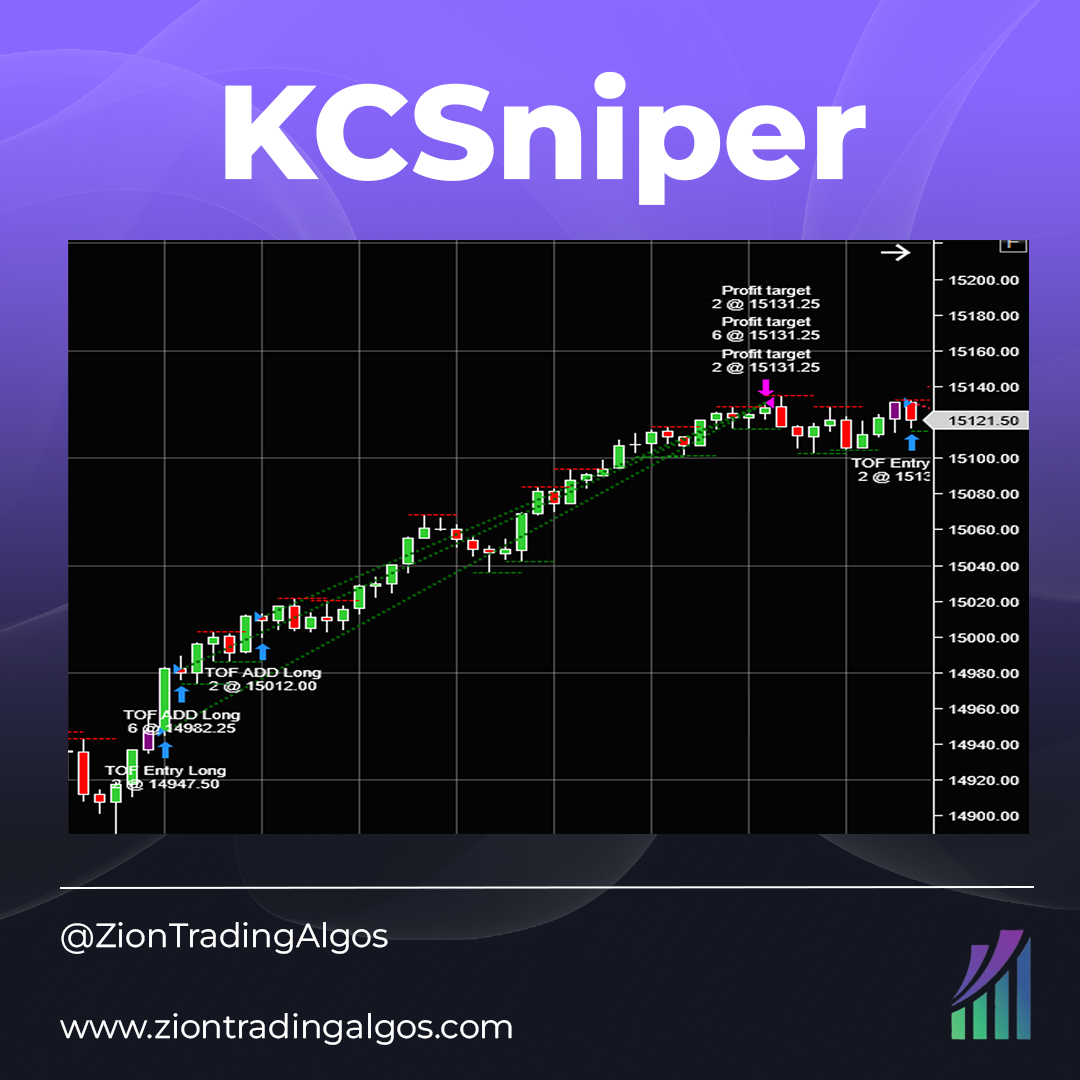
KCSniper is a Keltner Channel-based system on the 10-minute chart. It is long only and does not pyramid into positions, but has a single entry and exit model. It uses volatility based stop loss and take profit targets to remain adaptable. Trades MES and MNQ.
One on one online consultations! Choose from a New Trader Strategy Meeting to begin your new journey as an online trader, to installing and setting up Bloodhound, BlackBird or the HeatMap Pro! Get started today!
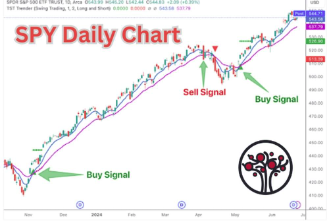
Serge Berger’s TST Trender indicator is designed to provide buy/sell signals at near-term turning points in stocks, ETFs, and futures. At its core, it uses a moving average crossover strategy with specific moving averages that have proven to work best on the daily charts (for swing trading).
The VTP was created to provide Veterans with an introduction to financial markets. The Stage 5 Online Course educates traders on how to approach their funding challenges within the Prop Firm space. It aims to helping support traders to succeed, and build a sustainable trading business.
Free trading psychology masterclass. Learn the complete trading psychology system to overcome destructive trading habits and reach pro-level consistency in as little as 8 weeks (even if you are starting with zero willpower and breaking your rules every time you trade). Register today!
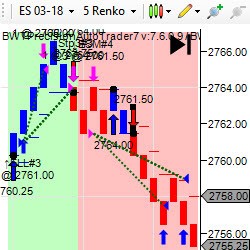
The BWT Precision Autotrader is a state of the art trading tool/software that automates most of the tasks of manual trading, like trail stops, daily goals, entries and profit targets. It uses a universal directional algorithm that brings accuracy, discipline, risk & money management to your trading.
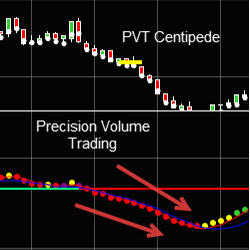
Precision Volume Trading Centipede is an indicator that works with all of our PVT tools including a moving average showing divergence.
The versatility of the system extends to both trend and reversal trading strategies, accommodating scalping, day trading, and swing trading. It seamlessly operates on various bar types and timeframes, offering dynamic Support/Resistance lines and intuitive market insights.
Live trading room for ES S&P 500 day traders. Based on Rose’s Fibonacci trading system, charts are posted and price action shared. Previous trades are reviewed so that students can improve. Discord chat room goals: help students become independent traders & provide a supportive community.
December 2, 2024
Mastering Sideways Markets With Auction Bars and Range Projections
November 19, 2024
Enhancing Your Automated Trading System: Key Insights from Best Pro Trade
November 14, 2024
NinjaTrader New Ecosystem Tools: October 2024 Edition
Enter Email for Updates