IAStealth signals the entry when the shorter time frame momentum has reversed back in the direction of the trend. More important is to know when the longer time frame momentum is showing signs of reversing. IAStealth alerts the shorter time frame after IAMomentum/IATrend alert the longer time frame.
The ATPMMT is an automated strategy designed to assist traders with the ever-difficult emotions of entering and staying with the trade. ATPMMT searches for potential entries throughout the trading session.
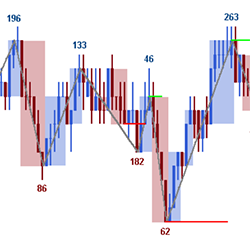
No need to stare at the chart and wonder or make guesses - the Raptor will tell you! The Raptor detects potential trades for you out of the box and will alert you when these trades are setting up. This gives you plenty of time to get into the market with zero stress.
Enhanced Decision-Making; Trading Awareness/Behavior. Basic Training accelerates improvement by strengthening behaviors causing the brain to filter, process, and apply information most effectively. Psychology, sociology and neuroscience are integrated to keep decisions ahead of price movement.
Get educational swing trading ideas for the Micro Emini S&P 500 and Micro Emini Nasdaq futures. These are real-time swing trading ideas that are posted to a private Telegram group for all users to read. Dynamic risk and position management are also included.
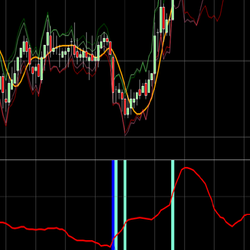
This indicator is extremely versatile and can be used in several time frame charts and even bar charts including range, tick or volume. It works best for instruments like NQ, ES or YM over tick charts. See the real price movement and identify the spikes in the curve plot.
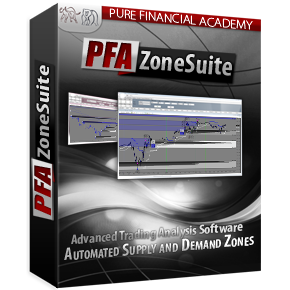
PFAZoneSuite is advanced supply and demand trading! Indicator package includes automated volume zones, volume profile, order flow analytics, trend lines, fibonacci retracements, market structure, trade data box and more! Compatible with NinjaTrader 8. Click here for a free demo!
Toni Hansen is uniquely positioned to share over two decade’s worth of trading secrets, methodologies and financial strategies with clients in this highly interactive and market-focused learning environment.
This 25+ Chapter Price Action Course plus 4 one-on-one hour long help sessions are designed to address trading hurdles you may be facing. This Couse Includes access to VIP discord, daily morning livestream, lifetime access to the course, and more!
The MAutoFloorCeiling indicator is the culmination of over 2 years of research to determine support / resistance levels automatically. The heart of it utilizes a powerful algorithm based on Wyckoffian concepts of waves, volume, and price levels to gain insight on potential entry points.
March 25, 2024
Trading Pullbacks and Reversals: Simplifying a Once Complex Retail Trading Strategy
March 21, 2024
VWAP Indicator: Average Price Shown Based on Price, Volume
March 18, 2024
Trade Copier Strategies: Make Efficiency Work for You When Futures Trading
Enter Email for Updates
 from Indicator Warehouse.png)