A comprehensive Automated System including 20 strategies covering a broad range of instruments and market conditions. Includes indicators, color backgrounds, and a powerful money management module to protect profits and principal. Learn more.
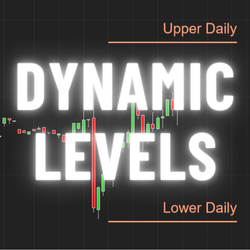
Dynamic Market levels calculated by Scalp Radar. The first market level provided by this indicator is the daily, weekly, monthly, and quarterly expected move. Based on the options market, these levels provide crucial insights into the estimated price ranges for popular symbols such as SPY and QQQ.
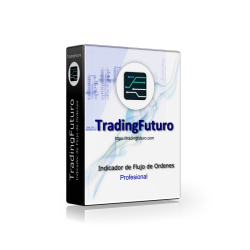
The TradingFuturo Order Flow toolset consists of several advanced indicators which allow the technical analysis of markets through the Order Flow technique. It is robust and high-quality software, validated by a large community of traders.
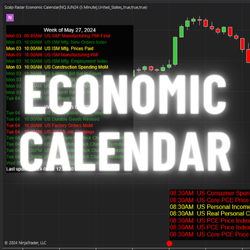
Stay ahead of market-moving events with this comprehensive news agenda, displaying upcoming events like CPI, PPI and Jobs data categorized by impact. Event marker are drawn directly on your chart with hover-over features. Filter by country, impact, or event name to optimize your trading strategy.
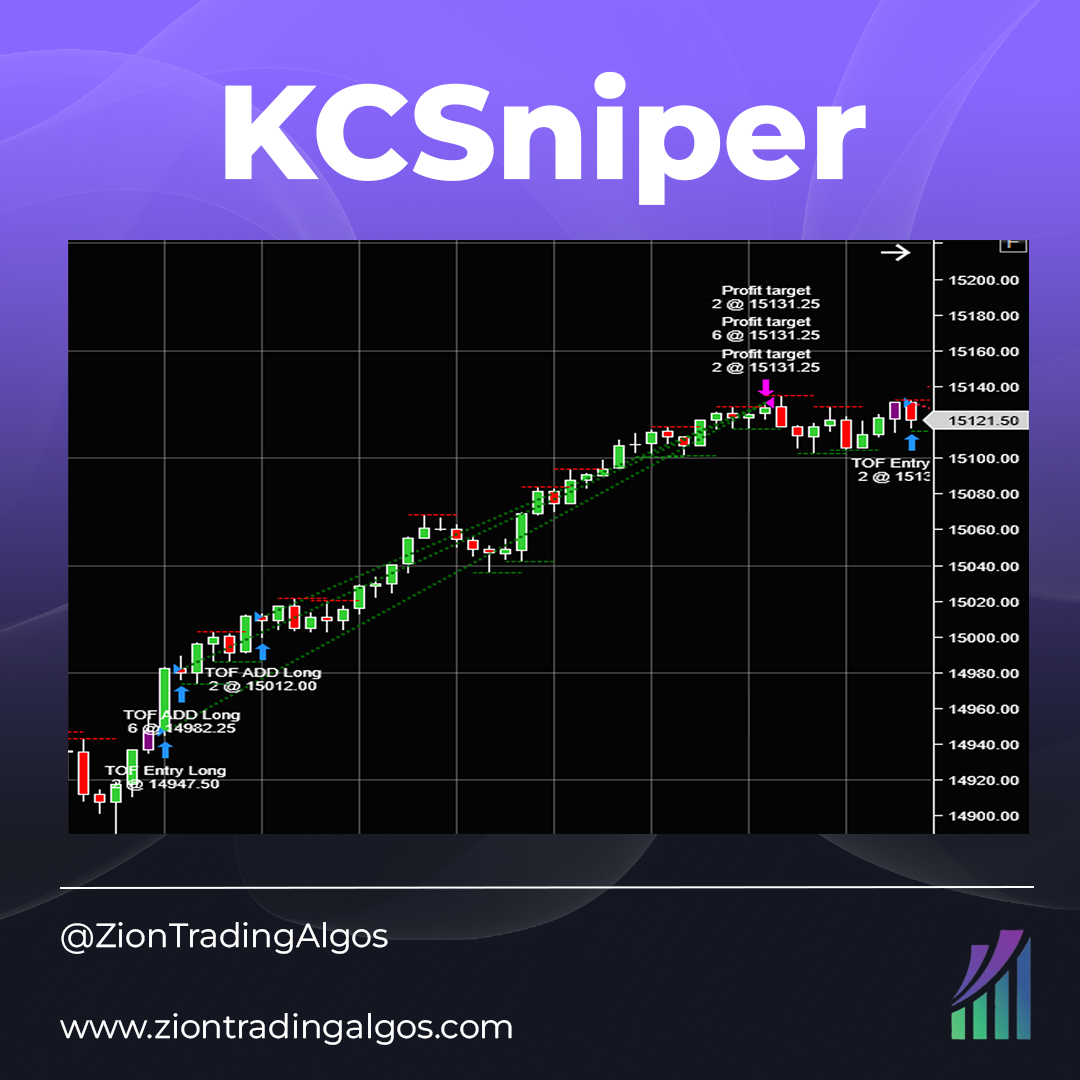
KCSniper is a Keltner Channel-based system on the 10-minute chart. It is long only and does not pyramid into positions, but has a single entry and exit model. It uses volatility based stop loss and take profit targets to remain adaptable. Trades MES and MNQ.
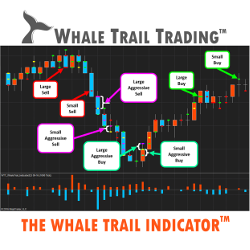
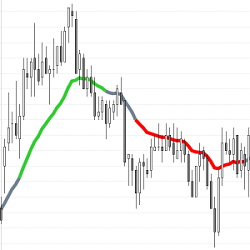
Let the Whale Trail Indicator replace years of reading trading books, attending lengthy and expensive seminars and unsuccessfully trading the markets. Easily follow the order flow in real time. Finally see how the largest whales trade the markets. Claim your free trial today!
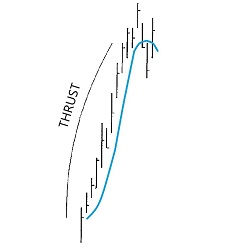
With this tool, traders can now find charts which have potential DiNapoli Directional patterns. Scan multiple markets & time frames in real time for Thrust and other patterns. Use as a chart indicator for easy recognition or as a market analyzer. Video instructions are included - try it today.
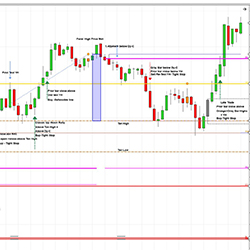
One-stop software for beginner & advanced traders. Proprietary intra-day structure & logic. Advanced time & price signals, custom built for ES, NQ & RTY. The markets opened 100 years ago with the same day timespan as today. See a NinjaTrader webinar free at DMIC2059.com. Use code NTW for a discount.
Do you wish to diversify your trading by following in the footsteps of successful traders? Do you wish to keep your forex broker and still follow successful traders? Would you like to do this at a very reasonable cost? If you answered "Yes" then this is for you.
This indicator uses recent bar closes to calculate the “Always In” direction to help traders determine market trends. Use the Simple Always In EMA as a discretionary indicator or for automated trading. It is FREE to download and use!
December 2, 2024
Mastering Sideways Markets With Auction Bars and Range Projections
November 19, 2024
Enhancing Your Automated Trading System: Key Insights from Best Pro Trade
November 14, 2024
NinjaTrader New Ecosystem Tools: October 2024 Edition
Enter Email for Updates