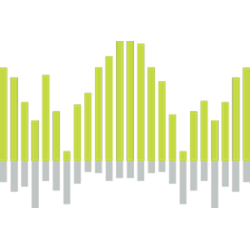
The LogikTickX utilizes signal processing and price reconstruction techniques to cut through the noise, reconstructing the true transaction, minimizing the hiding of large orders. This allows traders to identify and react to the market sentiment, and correlation between price and volume development.
Do you have a trading concept? Let's get it coded right now! Schedule a free consultation today with Yuri, algorithmic trader and full stack developer. NinjaCoding provides solutions for strategies, indicators & extensions to visualizers, database server integrations and third party conversion.
Prove you have what it takes to make money and we may fund you as a trader! We did it ourselves, we’ve done it for others, and we know we can help you, too. Learn. Get Funded. Trade! Come take the TradeDay Evaluation Challenge and get funded as a trader with our capital in live markets.
This platform offers a comprehensive library of trading indicators, tailored specifically for the web version of NinjaTrader and Tradovate. It’s a simple subscription service, giving you the freedom to fine-tune your strategies without the burden of buying multiple tools.
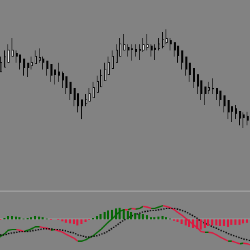
The EPyFMACD indicator has additional functionality such as Cross Color and UpDown, increasing the amount of visual information conveyed. The color and thickness of the EPyFMACD can also be customized.
tickmatrix is a small team of disciplined and dedicated programmers who architect intermarket trading strategies, indicators, API and more.
Master Futures, Pairs & Swing Trading: Dive into essential futures trading mechanics, craft robust strategies, and explore quantitative analytics for pairs & swing trading strategies with our comprehensive course. Join to optimize your portfolio and trade with confidence! Signup now!
The V Reversal Trading System was developed to capture the V Reversal patterns that have become more frequent in the Nasdaq since 2022. This is a mean reversion pattern that takes advantage of a market that returns to its mean intra-day. This strategy trades the E-mini or Micro Nasdaq futures.
Fully automated E-mini trading systems. These auto traders are designed to operate continually and without any human intervention. All of our systems have gone through extensive testing to ensure that hypothetical backtests are as closely representative of a live trading environment as possible.
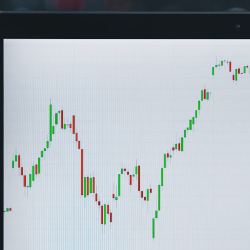
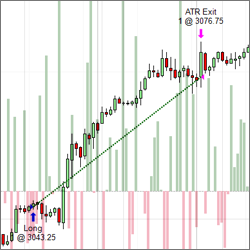
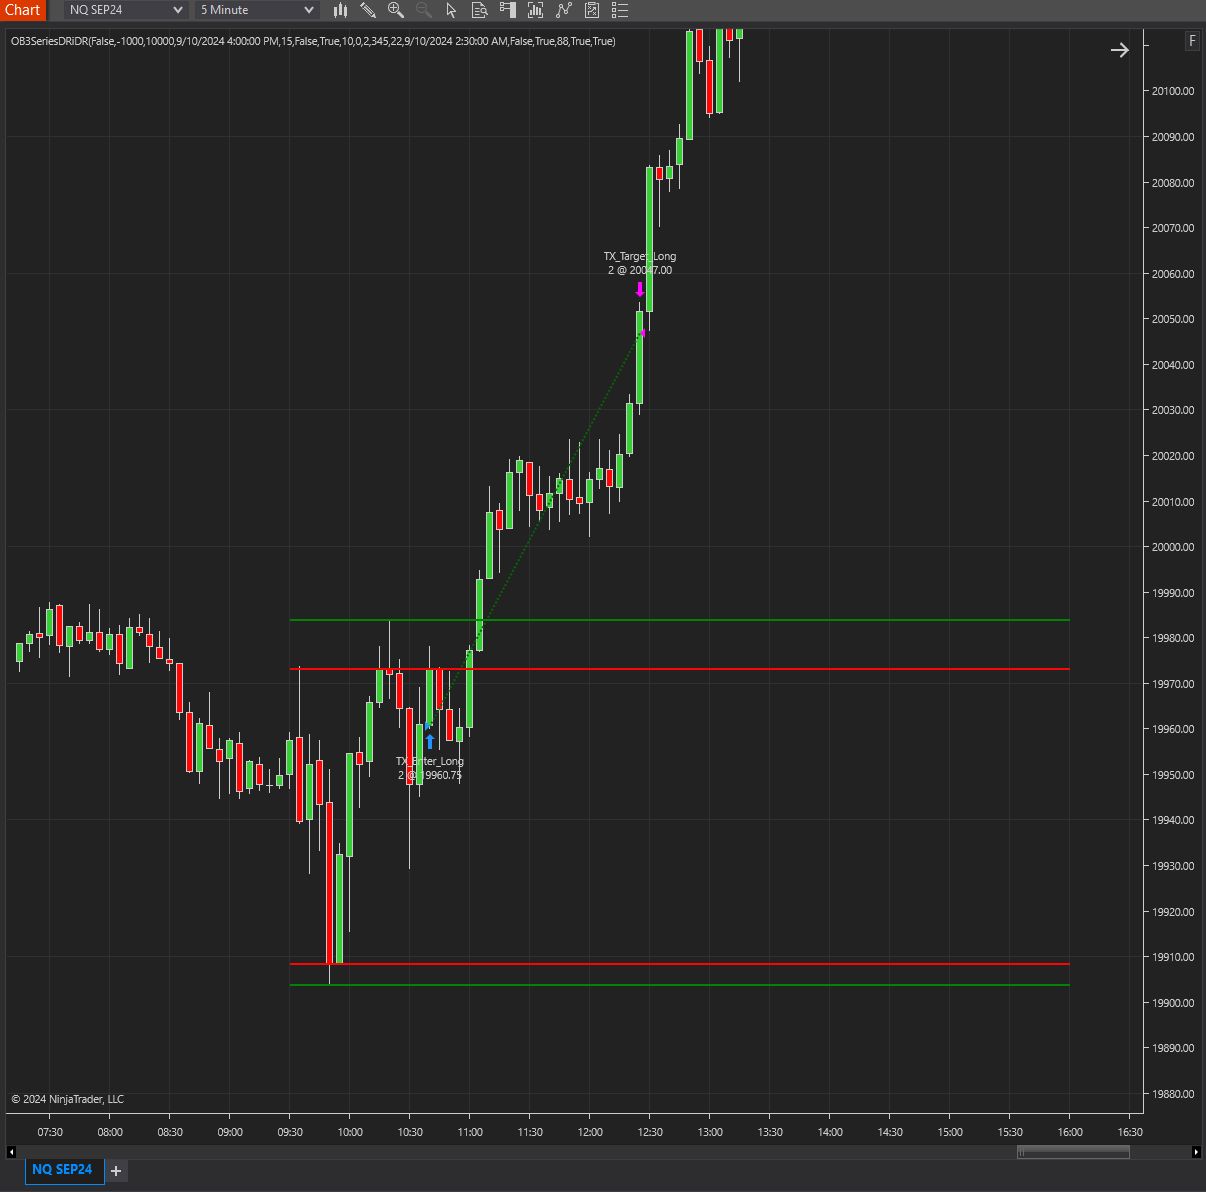
The DR/iDR strategy works by calculating the high, low, and close prices during the critical first hour of trading (9:30–10:30 AM) to determine the Daily Range. It then generates Implied Daily Range levels based on this data, providing clear markers for potential breakout or reversal zones.
December 2, 2024
Mastering Sideways Markets With Auction Bars and Range Projections
November 19, 2024
Enhancing Your Automated Trading System: Key Insights from Best Pro Trade
November 14, 2024
NinjaTrader New Ecosystem Tools: October 2024 Edition
Enter Email for Updates