Marmolillo is an automated trading system with a 3-year backtest, designed to trade in NQ, MNQ, ES or MES on the NinjaTrader 8 platform. The system only makes one daily entry and is compatible with manual operation once it has performed its automatic operation.
The first free trade copier for NinjaTrader coded to be as simple and fast as possible. Import NT FREE DUP. Add the primary account Sim_DUP. Select your replica(s). Click on "Start." Your Sim_DUP orders will be duplicated on your replica(s). Contact email: [email protected].
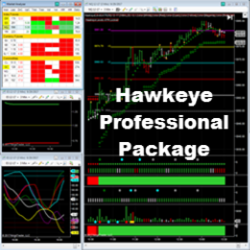
The Hawkeye Professional Package includes all Hawkeye tools for volume spread analysis, on multiple time-frames across all markets. These powerful indicators tell traders when a trend is commencing, in congestion and where to find the correct exit. Buy Now using code: “NT10Off” for a 10% discount.
Custom program your own indicators / strategies / add-ons / tools for NT8. We custom program fully or semi-automated strategies, indicators, add-ons and tools based on your requirements. All source code delivered with additional free tech support after delivery. Get a free, no-obligation quote now!
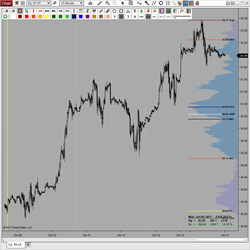
Volume Profile Composite features 7 configurable Profile Durations (including Daily, Weekly, Monthly, Contract, User Defined), 8 Levels of Significance (VPOC, VA’s, VWAP, High/Low/Mid, PClose), 3 Modes of Calculation (bar/min/tick), a profile summary, and simple configuration thru the toolbar icon!
Learn order flow trading from experienced full-time traders. We meet live multiple times each week - all meetings, clinics and workshops are recorded to our members library and you can interact 24x7 in our Slack group. We’re 100% focused on consistent trade setups and a FURU-free zone!
Free trading psychology masterclass. Learn the complete trading psychology system to overcome destructive trading habits and reach pro-level consistency in as little as 8 weeks (even if you are starting with zero willpower and breaking your rules every time you trade). Register today!
Learn from 25+ chapters that take you from A-Z, showing traders three go-to entry signals that are seen on all time frames. Join for lifetime access, yearly updates, VIP Discord access, live morning analysis stream, and more!
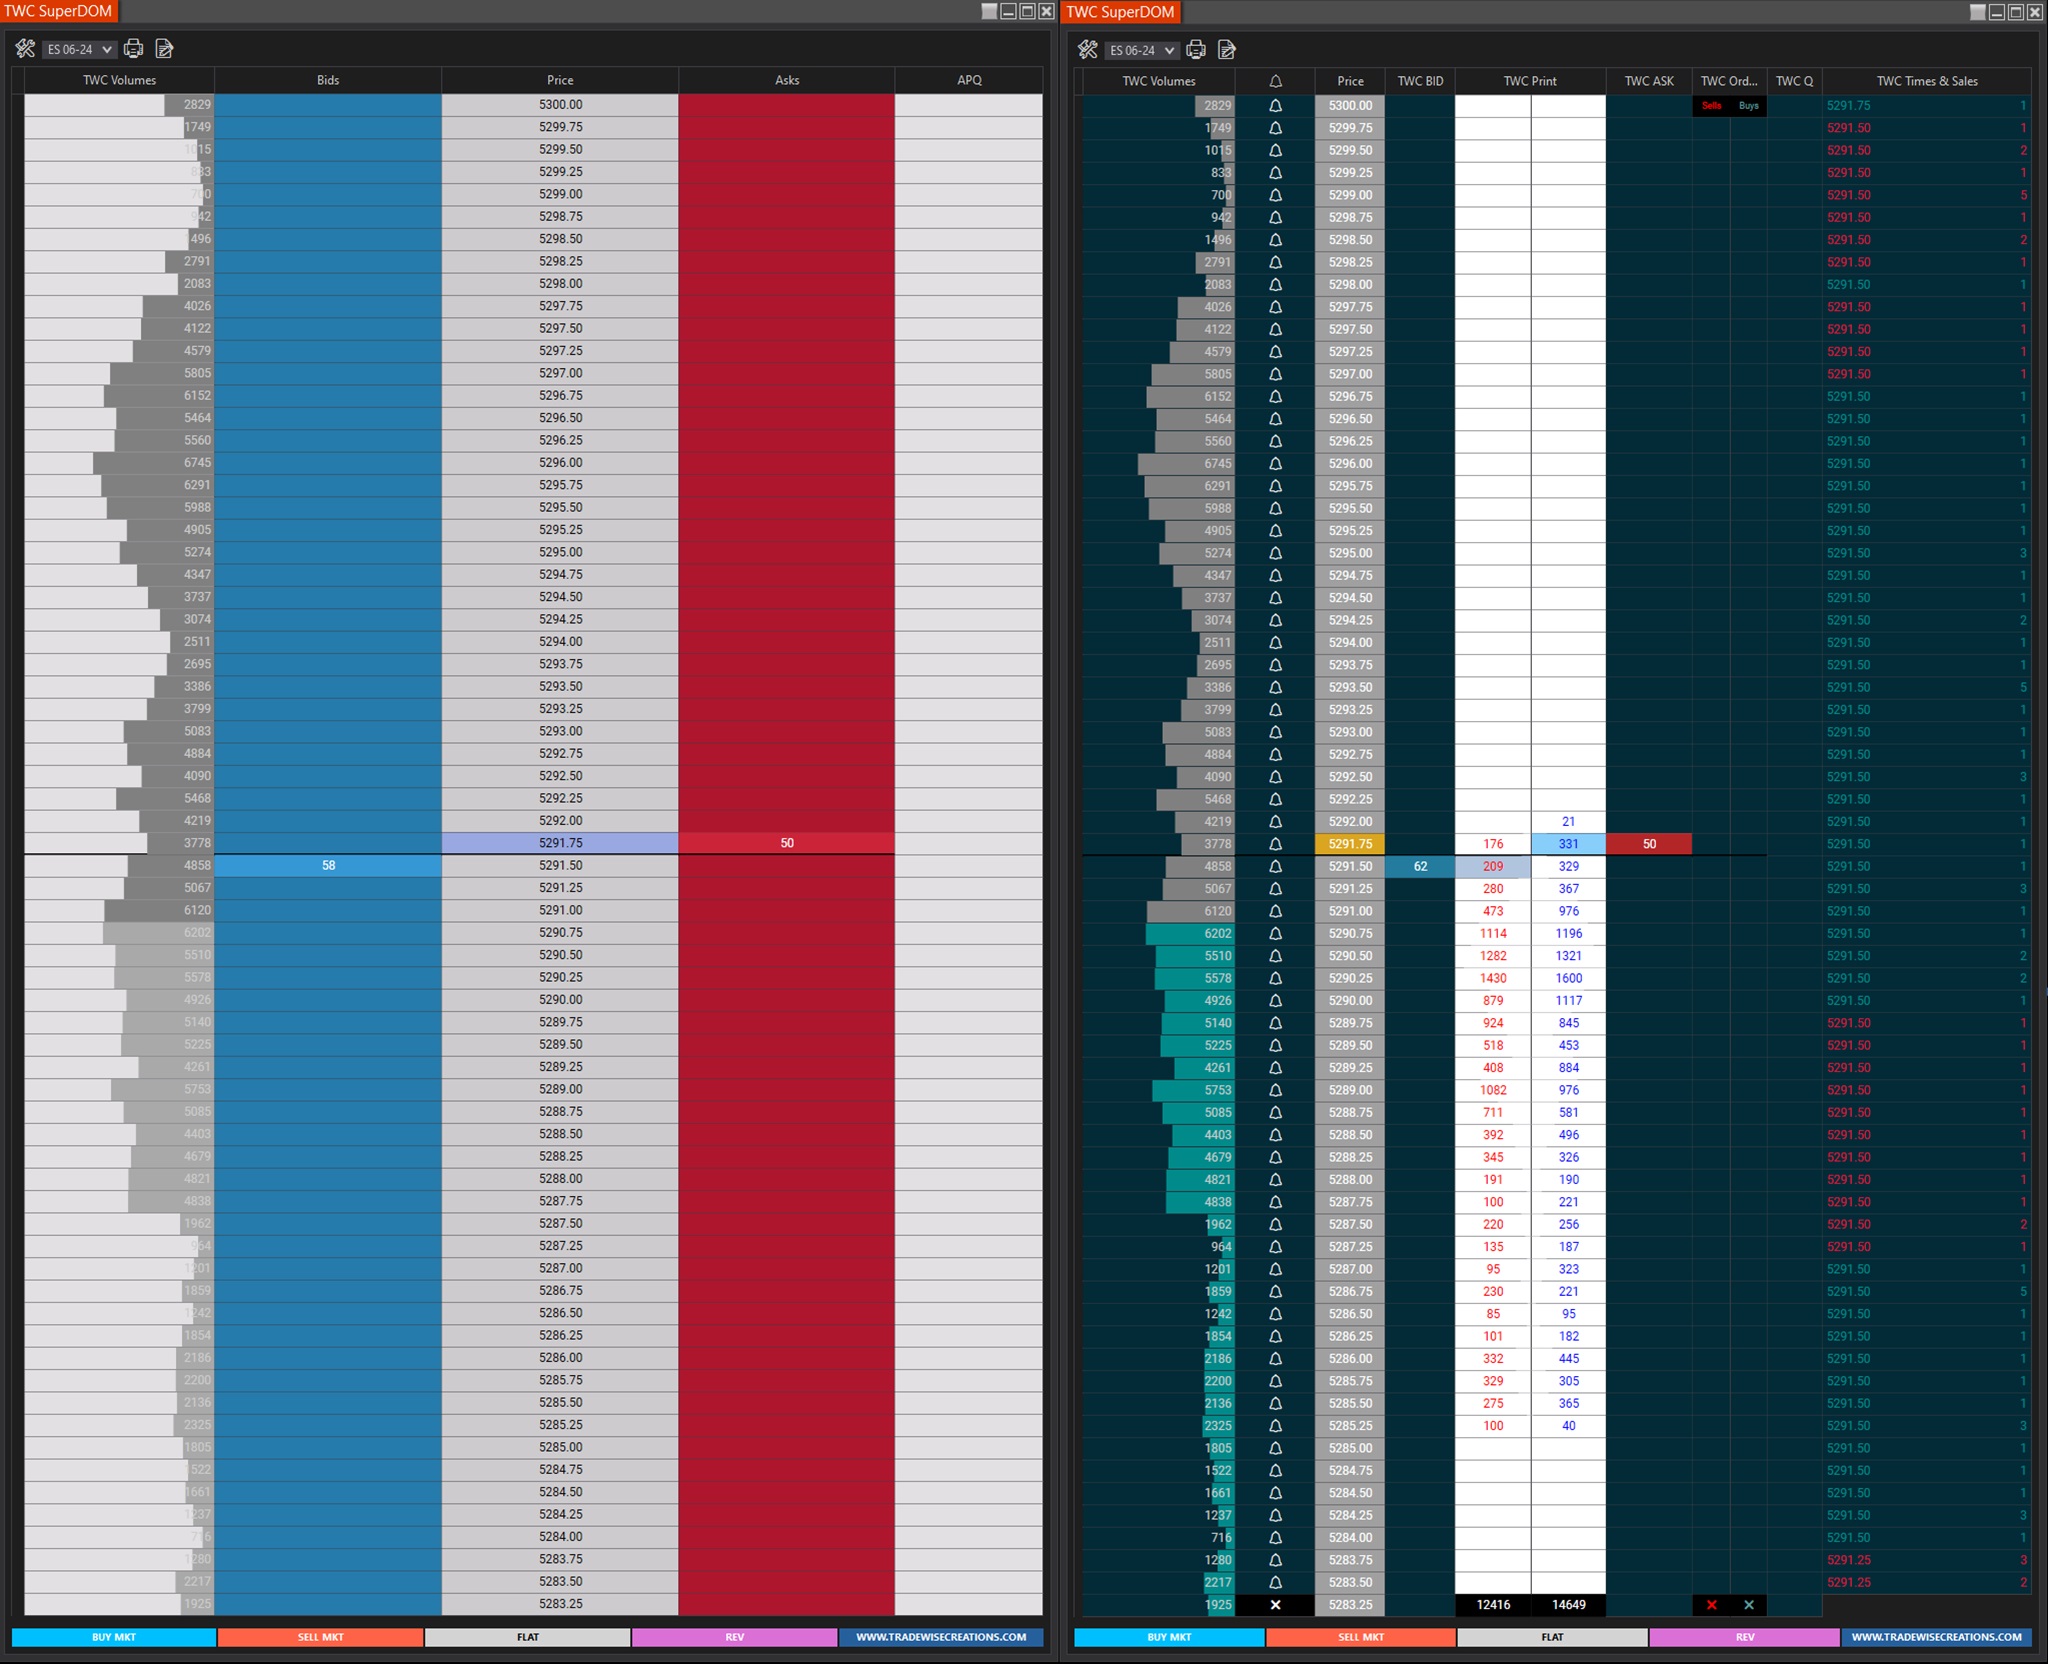
The Super Dom TWC displays a list of all buy and sell orders for a given asset, such as futures and currencies, along with corresponding prices and quantities. The team included all the essential setting and functionalities that traders need.
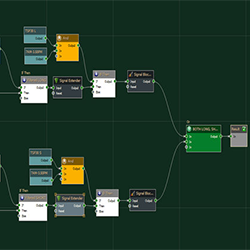
Custom strategy design in BloodHound. Remek! will program your trading strategy as per your specifications and requirements. Learn more!
December 2, 2024
Mastering Sideways Markets With Auction Bars and Range Projections
November 19, 2024
Enhancing Your Automated Trading System: Key Insights from Best Pro Trade
November 14, 2024
NinjaTrader New Ecosystem Tools: October 2024 Edition
Enter Email for Updates