The Ultimate Pivot Points™ (UPP) Indicator Package is the most advanced and extensive collection of “Pivot Points” Indicators available. It includes every “Pivot Point” method along with several innovative features — making it one of the most complete Support/Resistance indicators on the market!
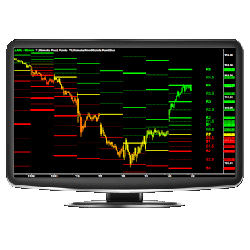
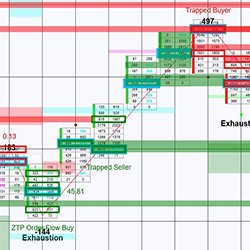
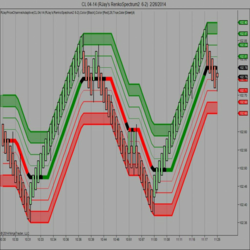
The ZoneTraderPro Order Flow Pattern Indicator identifies 7 different patterns, including tops and bottoms in a market using the Point of Control, trapped traders, ratios, historical support and resistance, and the exclusive ZTP Order Flow. Learn when to buy and sell based on order flow!
Download a 14-day test period of this trading indicator that identifies points to enter the market for price pullbacks and reversals. The indicator uses pure price action, which makes it possible to get rid of lagging indicators. Be independent of the values and stage of the market.
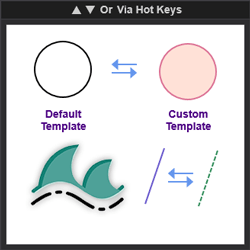
This indicator allows the user to switch a draw object's template on the fly without having to dig through various menus. This increases application functionality and user charting efficiency.
This is a machine learning/price action-based automated scalping algo. It runs on a custom bar type with multiple price action algos to choose from. Custom control panel allows the trader to control and manipulate the strategy while its running and also manage multiple strategies at once.
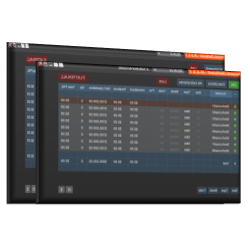
Save money by purchasing the Ultimate Account Management Bundle for NinjaTrader! This all-in-one solution combines their premiere Duplicate Account Actions trade copier and their top-rated Account Risk Manager at a better price!
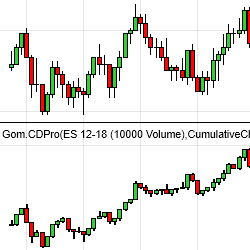
GomCD for NinjaTrader 8 displays the Delta information of the chosen instrument. It shows cumulative or non-cumulative charts, for easy delta analysis and delta divergence identification. It can also be used in custom NinjaTrader strategies and the Market Analyzer.
Download this free indicator that allows you to trade directly on your chart. You no longer need to use buttons to enter the market. With this indicator, you can select your entry point directly on the chart. Quickly place limit orders with a single click of the mouse (no need to right-click).
Choose from an assortment of indicators with enhancements not found anywhere else. (Digital Clock, Bar Timer, Divergence, Price Channel, Current Bar Range). Get free trials of these unique indicators now!
View stops and targets on your screen based on the ever-changing average true range.
December 2, 2024
Mastering Sideways Markets With Auction Bars and Range Projections
November 19, 2024
Enhancing Your Automated Trading System: Key Insights from Best Pro Trade
November 14, 2024
NinjaTrader New Ecosystem Tools: October 2024 Edition
Enter Email for Updates