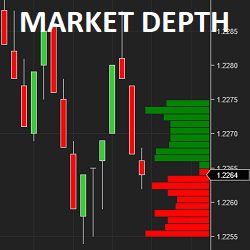
itcMarketDepth is an indicator used to read depth of market data. Reading the depth is useful to qualify key support & resistance levels. This helps traders to know if a level will hold or break. itcMarketDepth can be customized by color, size of bars, filter, number of elements to display & more.
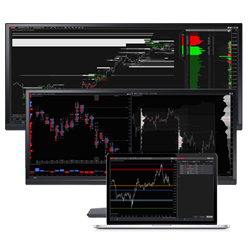
Rancho Dinero's full suite of Acme-brand volume, time, price and order flow analysis tools provide you everything you need to gain deep insight into your markets from multiple perspectives. Study your instruments. Strategize & define your risk. Stalk your trades and when opportunity knocks, strike!
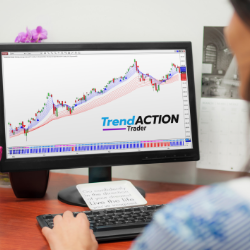
Trend Action Trader keeps you on the right side of the market with clear high probability signals for all markets and timeframes. Its price patterns and momentum algorithm are ideal whether you trade short or long term. Improve your trading consistency - try risk-free for 30-days!
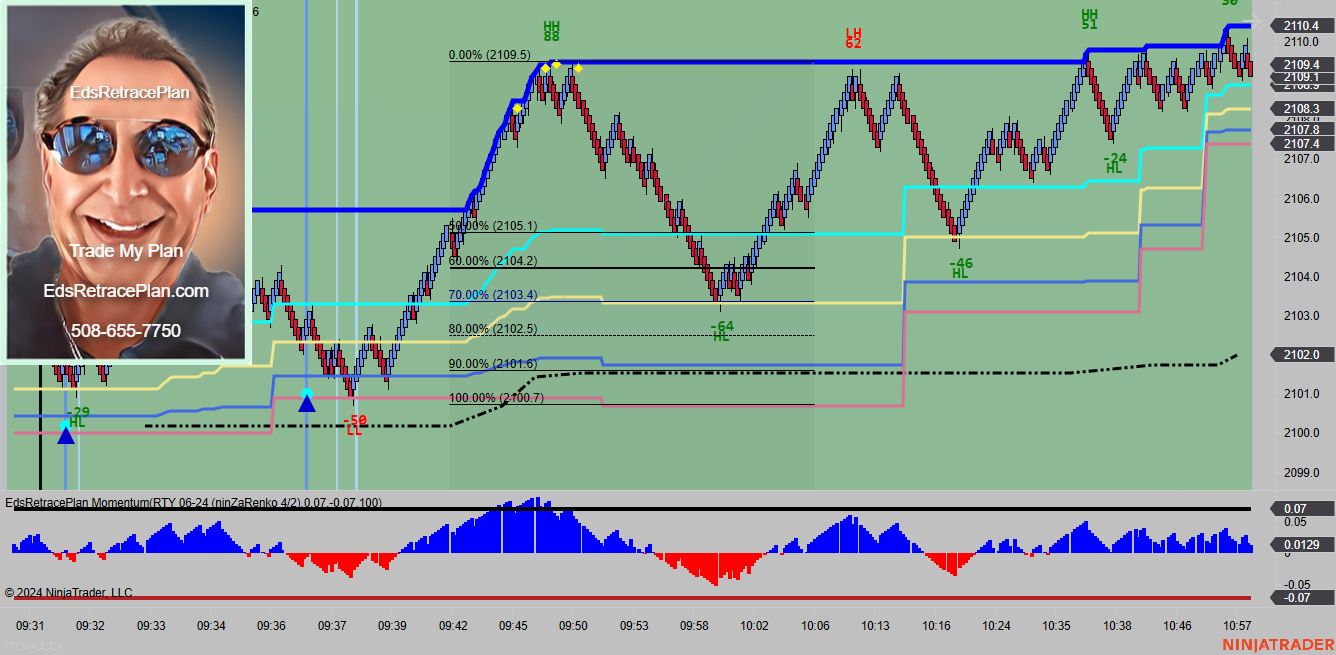
EdsRetracePlan Momentum Reversal Indicator is for day trading ES, YM, RTY, NQ, CL and GC. The indicator identifies reversal trades by finding and marking tops and bottoms. These trades signal the end of a move and opportunities to get short at the highs and long at the lows.
Trade like a pro with the proprietary Alpha Fibonacci System, traded globally by traders of all levels & instruments since 2011. The lifetime system includes Multi Market Scanners with group or private mentoring courses and a video library, modules and trading room included. [email protected]
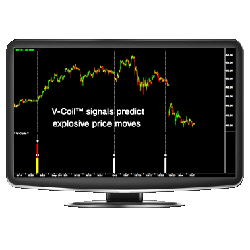
The V-Coils™ & NR Breakouts Indicator Package detects significant contractions and expansions in volatility and Average True Range (ATR). It issues signals when there is a very high probability for an explosion in volatility - leading to huge price moves that traders can take advantage of.
The QTradez Consulting service offers guidance on the best way to create and support NinjaTrader add-on products. With over 10 years of NinjaScript development experience, QTradez consulting staff will deliver the exact information you seek as simply & cleanly as possible.
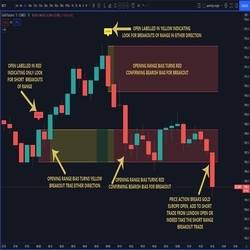
Defines the opening ranges of major markets, gold and oil pit opens, and major data points. The range has a cloud which automatically changes color depending on the market bias and continues until the open the next day. This allows for multiple entries of breakouts throughout the following 24 hours.
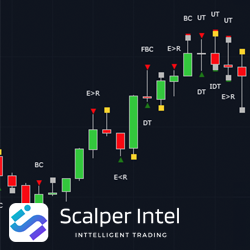
This indicator focuses on identifying the Sign of Strength (SOS) and the Sign of Weakness (SOW) for you and plots them on the Chart. This indicator also studies "The Next Bar" to confirm/refute SOS/SOW.
XABCD News puts news events on your chart so you're not surprised when news comes out. It works in any market and provides a visual marker for scheduled economic news for the current seven-day week, from Sunday to Sunday. Get your free copy today.
December 2, 2024
Mastering Sideways Markets With Auction Bars and Range Projections
November 19, 2024
Enhancing Your Automated Trading System: Key Insights from Best Pro Trade
November 14, 2024
NinjaTrader New Ecosystem Tools: October 2024 Edition
Enter Email for Updates