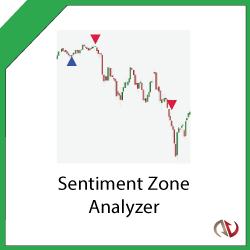
Use the Sentiment Zone Analyzer to measure overall market sentiment to spot trend reversals early! Based on the premise that extremely bullish or bearish tendencies will eventually lead to trend reversals. Dynamically calculates overbought and oversold levels based on previous price action.
The Smart Momentum NinjaTrader Indicator tool has a unique design compared to other momentum indicators. It uses an averaging mechanism that analyzes the cycle and adapts to it. This results in a momentum plot that is simultaneously smooth and sensitive.
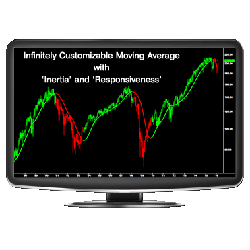
The ZMA™ is the most adaptable and customizable moving average indicator to date. By using an algorithm that incorporates the concepts of inertia, energy, and responsiveness, the ZMA is infinitely flexible and significantly more effective than other moving averages available.
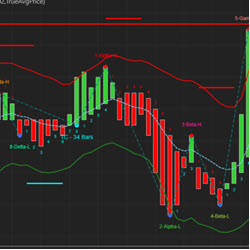
The Flow of fund(FOF) divergence signal indicator consists of the following parts: The Flow of fund histogram, FOF trend line, back test result in sub chart and divergence signal in main chart. The signal is instantly drawn on current bar and will not repaint.
One on one online consultations! Choose from a New Trader Strategy Meeting to begin your new journey as an online trader, to installing and setting up Bloodhound, BlackBird or the HeatMap Pro! Get started today!
The CB Internals Panel shows you the breadth of the market long and short term. Combined with custom audio alert, it lets you know when the market is moving. It has been in development since 2016, and the current version stands alone.
Experience a revolutionary approach to charts, utilizing moving averages for open, high, low and last prices. Explore diverse chart types, including minute, tick and volume charts. Uncover trends and reversal patterns.
QWLoL is a new concept indicator – “LoL” stands for Limit of Length. That is what we are looking for in situations where the market is moving sideways but there is trending inside the curve. The challenge is to identify the length of the curve & estimate with consistency whether the price rebounds.
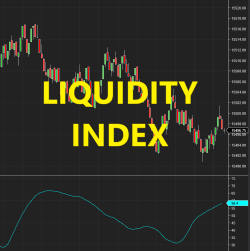
Liquidity is one of the most important signals that traders can pay attention to in the market. It shows how market participants are feeding the price levels. It is not only for limit orders but also related to the speed that traders and institutions can respond to new price actions.
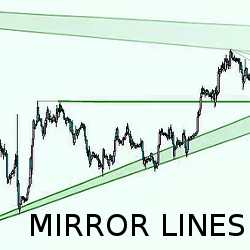
Receive trend forecasts in NinjaTrader 7. MirrorLines paints graphics on the chart that spread out like a torch beam, representing forces hidden within the market’s price structure. Traders can use this data to plan trade entries, stop losses, and smart profit targets.
December 2, 2024
Mastering Sideways Markets With Auction Bars and Range Projections
November 19, 2024
Enhancing Your Automated Trading System: Key Insights from Best Pro Trade
November 14, 2024
NinjaTrader New Ecosystem Tools: October 2024 Edition
Enter Email for Updates