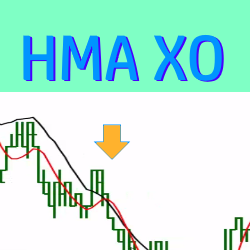
This trade setup indicator paints entry signals each time a Hull Moving Average (HMA) crossover occurs. The entry signals are customizable and can be filtered by the slope of the linear regression. Click here to watch a video and lean more!
Know that you’re an amazing trader but finding the funds to get started is the one thing standing in your way? At UProfitTrader, we can help! Simply choose the size account you’d like, show us what you’ve got through our unique testing process, then start turning your passion into a profession.
A trend resembles a wind: it has both direction and strength. ninZa.co researched and developed Nova Wynd as a lag-free indicator purely based on ATR and price action without moving averages or smoothing. Get it today and start seeing which way the wind blows!
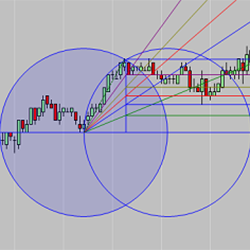
Attention Fibonacci, support/resistance, Gann & market structure enthusiasts! The HarmonicFan draws an A-B line & 2 intersecting arcs are calculated. The upper or lower half of the resulting Vesica Piscis formation is then divided into Fib levels & trend lines are then created as a fan. Learn More!
Automatic ATM Entry Assistant (AUTOBOT) can be used with our indicators and others using native Ninjatrader 8 Arrows or Triangles on the chart. Set up complex entry parameters without coding. Continue to our product page to see the 25-minute video of how it works.
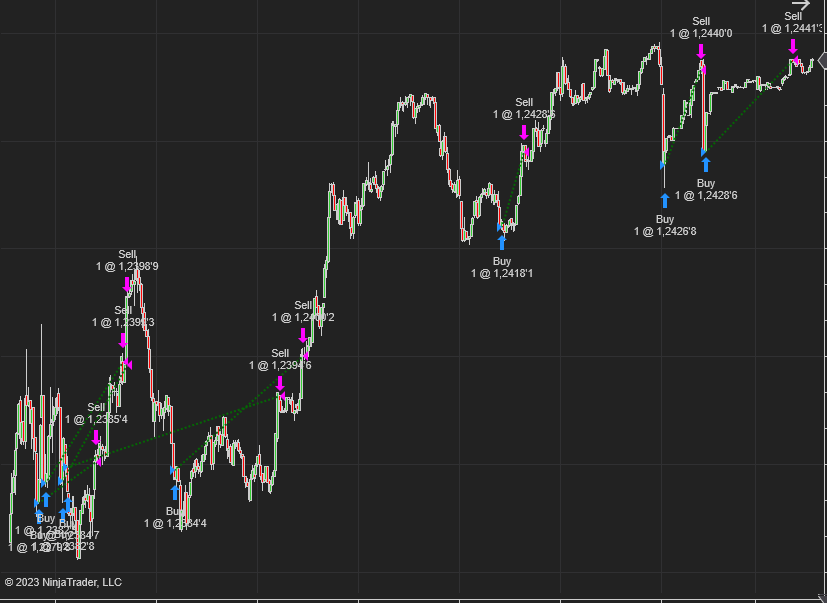
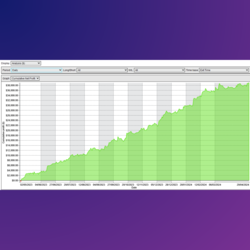
This NinjaTrader strategy identifies major trends, supports/resistances and supply/demand zones and accumulate positions with fractional orders at key price levels and try to resell at profit. The risk management is inbuilt and sophisticated.
Scalping: Takes fast and precise trades. Dual-Exit Strategy: Take Profit and Stop Loss. Finds patterns in the data and defines probabilities. Choose the number of contracts. Optimize parameters and adjust your trading style. Works in the NQ and GC futures contracts.
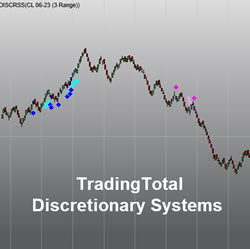
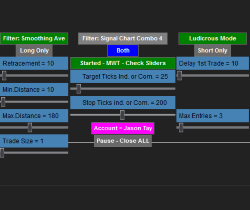
TradingTotal Discretionary Systems replicates several popular TradingTotal automated strategies entry rules for manual trading modality for future instruments.
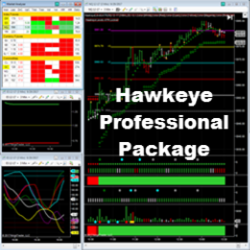
The Hawkeye Professional Package includes all Hawkeye tools for volume spread analysis, on multiple time-frames across all markets. These powerful indicators tell traders when a trend is commencing, in congestion and where to find the correct exit. Buy Now using code: “NT10Off” for a 10% discount.
Maximize trading with Modena Wick Trader, offering total control, dynamic market adaptation and custom settings for optimal efficiency. Automation to the next level!
December 2, 2024
Mastering Sideways Markets With Auction Bars and Range Projections
November 19, 2024
Enhancing Your Automated Trading System: Key Insights from Best Pro Trade
November 14, 2024
NinjaTrader New Ecosystem Tools: October 2024 Edition
Enter Email for Updates