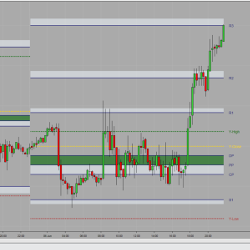
Session Pivots are a well known trading technique to calculate intraday support and resistance points. Because of its simplicity and efficiency, it is still a very reliable method for determining key support and resistance levels.
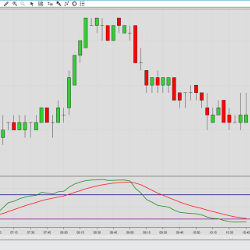
The Slow Relative Strength Index is an adaptation of the classic RSI calculation, customized for use in higher timeframes. The slow RSI calculation compares the close price with an exponential moving average instead of the previous value.
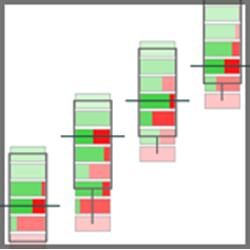
LogikBarProfiler is a feature-rich bar volume / tick / price distribution heads-up display analysis tool. It displays data computed within each bar, as well as buyer v. seller distribution at price levels. This combines the usefulness of POC, delta, and activity analysis into one intuitive tool.
KingRenko$ is the real “face” of ninZaRenko. It has no artificial open and only real data, so you can see for sure the real OHLC of a KingRenko$ candle. As a result, KingRenko$ can be accurately backtested.
Free Room includes sessions to learn trading tips, watch live markets, and news releases. There are evening and early morning special sessions to prepare for the day, and week ahead. See live market setups and learn how to manage risk and trades.
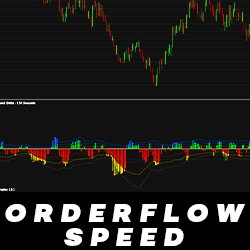
Deceptively simple, Orderflow Speed allows you to monitor market speed and enables you to view trading activity directly from your chart. It supports the Tick Replay feature so that you can visualize historical trading activity.
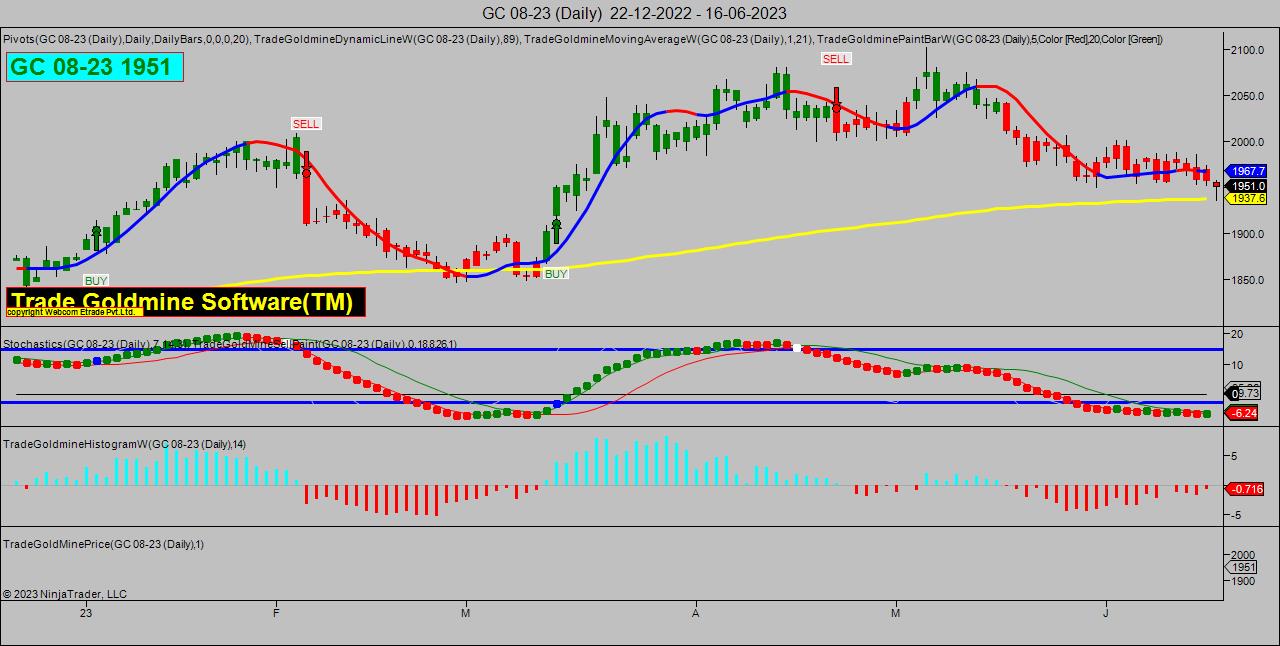
GOLDMINE NINJA TECHNIQUE software is a technical analysis tool that gives user-friendly BUY-SELL signals to traders and helps find perfect resistance & support levels in order to trade more effectively.
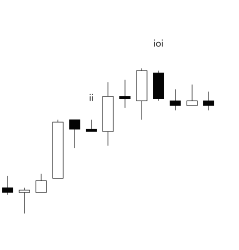
Breakout Mode Patterns from Brooks Price Action methodology.
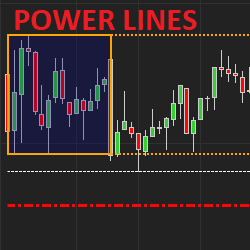
The itcPowerLines indicator displays important intraday support/resistance levels for stock traders (Opening range, morning H/L, yesterday H/L, Weekly H/L, daily SMA/EMA). Colors, styles & width are customizable. Users can also define which elements to display including levels for past days.
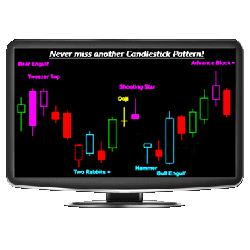
Want to scan for any candlestick pattern, on any timeframe, across any list of symbols? Whether you're interested in the most common or advanced patterns, the Candlestick X-Ray™ detects over 90 unique candlestick patterns, making it a highly flexible and powerful candlestick pattern tool.
December 2, 2024
Mastering Sideways Markets With Auction Bars and Range Projections
November 19, 2024
Enhancing Your Automated Trading System: Key Insights from Best Pro Trade
November 14, 2024
NinjaTrader New Ecosystem Tools: October 2024 Edition
Enter Email for Updates