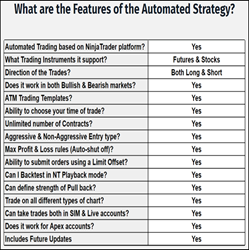
Automated trading tool designed to execute any futures contract based on a combination of predetermined settings and user-defined parameters. It aims to provide high-quality and statistically improved trade entries. One can use these strategies for day trading, and/or scalping intraday price moves.
Dynamic Market levels calculated by Scalp Radar. The first market level provided by this indicator is the daily, weekly, monthly, and quarterly expected move. Based on the options market, these levels provide crucial insights into the estimated price ranges for popular symbols such as SPY and QQQ.
AITP Prop Trader is a unique automated trade management system. This automated trading software is designed to help prop traders manage money and control every aspect of their trades.
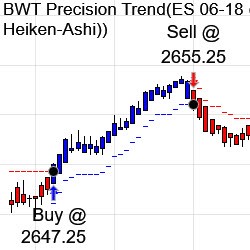
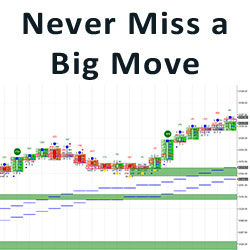
The BWT Precision Indicators originated in 2004. The BWT Precision Trend Indicator provides well placed potential trade signals and never misses a major move on your charts. Other BWT Indicators provide decision support using volume and price action.
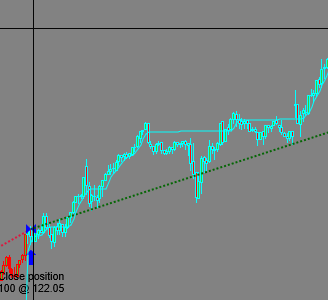
A trend following tool that can achieve exceptionally high risk/reward ratios when applied to suitable markets that trend well. Locks onto trends and does not let go until the trend ends. Not entirely suitable for novices. Strategy, paint bar and indicator included. Automated or manual operation.
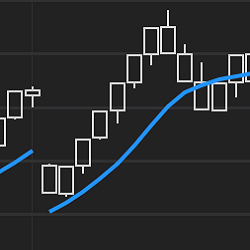
Optimal Filter is a truly unique moving average. It auto-adapts its lookback period for the best responsiveness. It has opening gap filtering technology and is colored, not by slope, but by overall market direction. Strategy compatible.
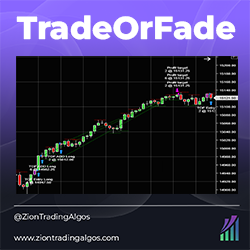
TradeOrFade is a momentum-based intraday strategy on the 5-minute chart. It determines whether or not there is an opening gap on NQ and takes advantage of statistically relevant information regarding gap ups and gap downs. It takes a starter position and pyramids into the position.
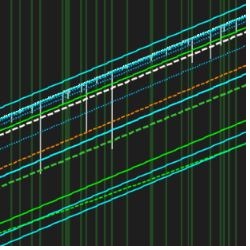
BuySide Global’s proprietary software algorithms track Institutional Traders as they change their bids and offers, identify when Institutions are selling into the highs or buying into the lows and deliver real-time buy and sell signals on time-tested strategies. Learn more!
This custom BloodHound template is setup for the UniRenko Bar and waits to trigger signals as the market pulls back into the moving averages. The JATS X-RE-X Blackbox BloodHound Template allows you to execute at the specific EMA entry locations after pullbacks.
Our Stock Trading Package includes pre-built workspaces, chart templates and Market Analyzers with scanners and alerts. Use ATS Chart Trader for trade management, ATS Inflection Point indicator for daily inflection points and use DTS Ichimoku Cloud Pattern for trade setups. Education is included!
December 2, 2024
Mastering Sideways Markets With Auction Bars and Range Projections
November 19, 2024
Enhancing Your Automated Trading System: Key Insights from Best Pro Trade
November 14, 2024
NinjaTrader New Ecosystem Tools: October 2024 Edition
Enter Email for Updates