The iCinDER™ MF (Market Forces) includes all of the iCinDER™ family of indicators as part of a complete set. The analysis is based on internal market force of the instrument being analyzed. Learn more!
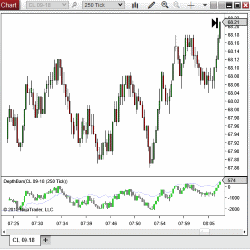
The Depth Bars & Pull-stack indicators by PureAlgo Capital detect changes in the total bid depth and total ask depth, providing a better idea of whether the bulls or bears are in control of the market & which players are about to fold.
We have added two new products for market analyzer. One works in conjunction with DualTrend 2.0 to keep you aware what market is trending so you can trade with the trend. The other works with CB ZoneChart V5. It will let you know if your market is in the lower zone or Upper Zone.
Elevate your trading with CyMo Pro, a dual-indicator system for eMicro and eMini Indices. The Cycle indicator identifies key price movements, while the Momentum indicator confirms trade readiness. CyMo Pro’s algorithms anticipate reversals and track trends up to three bars ahead.
100% FREE - The TAS Market Map Indicator delivers the most visually appealing customizable market profile tool for traders. Its color-coded sideways histograms clearly reveal volume at price, value areas (red zones), master point of control lines (aqua lines), gaps and congestion.
PFAZoneSuite is advanced supply and demand trading! Indicator package includes automated volume zones, volume profile, order flow analytics, trend lines, fibonacci retracements, market structure, trade data box and more! Compatible with NinjaTrader 8. Click here for a free demo!
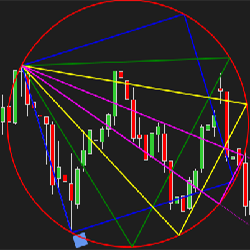
We are pleased to bring NinjaTrader users this tool typically reserved for expensive institutional platforms. The Gann Emblem is a drawing tool for those familiar with its applications, especially traders of the Gartley method.
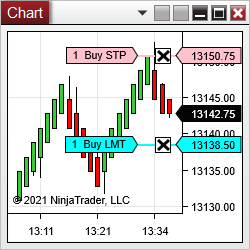
Clicker allows one to enter orders with one click directly on the chart! Modifier keys and mouse buttons for buying and selling are configurable. The order type is detected from the clicked price relative to the market price. All order parameters come from ChartTrader. Free trial for seven days.
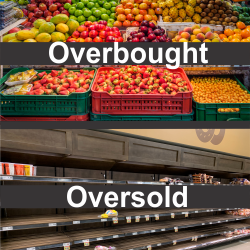
No subchart indicators or additional time frame charts are required to see when price becomes overbought or oversold. This helps the trader identify weakness in an uptrend or strength in a downtrend to anticipate a potential change in price direction. An award winning "heads-up display" indicator!
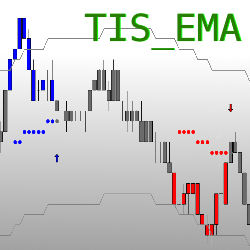
The TIS_EMA_Trader Setup trades bounces over a user defined Exponential Moving Average, making it ideal for low volatility trending markets. The logic of this system can also be inverted for a unique trade setup.
December 2, 2024
Mastering Sideways Markets With Auction Bars and Range Projections
November 19, 2024
Enhancing Your Automated Trading System: Key Insights from Best Pro Trade
November 14, 2024
NinjaTrader New Ecosystem Tools: October 2024 Edition
Enter Email for Updates