This is an intensive one-week course that by the end of the week will have you making confident trading decisions on various asset classes. If you have an inner trader we will find it. This course also includes a free trading challenge to qualify for a funded trading account.
The BWT Precision Autotrader is a state of the art trading tool/software that automates most of the tasks of manual trading, like trail stops, daily goals, entries and profit targets. It uses a universal directional algorithm that brings accuracy, discipline, risk & money management to your trading.
Day Trading Radio is a live online market broadcast led by John Kurisko, a full-time trader of nearly 25 years. The show kicks off every morning around 8:30 am (EST) with live trading and technical analysis of the markets in real time. Get trade alerts and trade with 100’s of traders every day.
TradeDevils Indicators offers unique indicators for NinjaTrader 8. Regardless of whether you are a scalper, a trend follower or a breakout trader, they can provide you with the right indicators to assist with your trading.
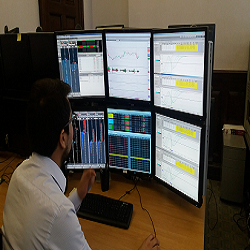
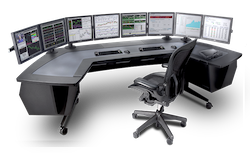
Immerse yourself in a dynamic trading environment with AmerTd's On-Site & Virtual Trading Rooms. Equipped with the latest technology and real-time market data, this state-of-the-art facility offers a collaborative space for traders to execute strategies and maximize their potential.
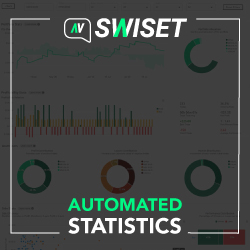
The platform is responsible for finding multiple patterns in operations and provides statistics which help traders in the decision-making process. Try it now free!
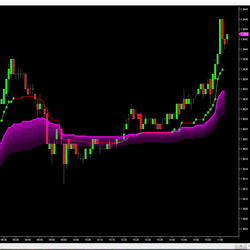
DTB River is an implementation of DTB Waves on non-time based charts and the results are plotted on time-based charts. It provides an added layer of noise filtering for waves. During the consolidation phase DTB River flattens out.
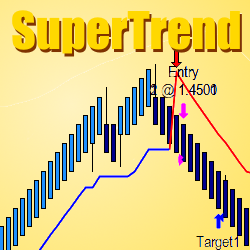
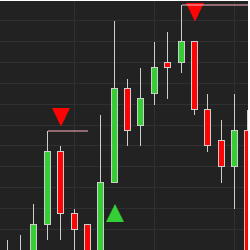
The TIS_Supertrend Indicator is a tool designed to trade volatile markets. The indicator produces 2 types of signals, a trend change arrow each time a trend line is broken and a pullback entry subsequent to the trend change. Download the TIS_SuperTrend today!
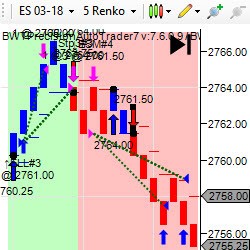
Latency protection is built in to protect you during fast moves. Trend following technologically advanced product with a complex algorithm that adjusts stop distance. SAR type operation. Not to be confused with other SARs that don't change trend until the bar closes. This does it in real time.
New "Ultimate A.I." indicator has it all: buy and sell signals, trend reversal signals, scalping signals, pullback alerts and stop loss placement lines. It’s multiple systems all in one. Learn more! Watch a demo tutorial by clicking the link! We also have a private chat group. Get a 5 day trial!
December 2, 2024
Mastering Sideways Markets With Auction Bars and Range Projections
November 19, 2024
Enhancing Your Automated Trading System: Key Insights from Best Pro Trade
November 14, 2024
NinjaTrader New Ecosystem Tools: October 2024 Edition
Enter Email for Updates