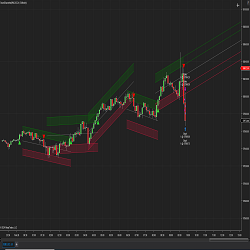
Channel levels are defined based on high and low prices influenced by candlestick bodies. These points are calculated based on the defined channel levels and look back periods. Delta values are computed to determine the channel's upward or downward slope.
Do you want to overcome the challenges that often leave traders feeling overwhelmed and uncertain? Introduction to the Trader Brain will give you the practical knowledge to solve your money-losing patterns.
PriceIsKing.com's Stocks RAM Indicator is a powerful tool based on years of research and testing that shows equities traders entry points with arrows when the right condition is met. Get started with a free 2-week trial today!
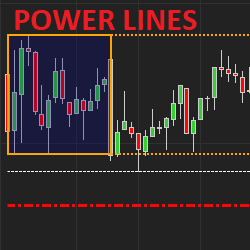
The itcPowerLines indicator displays important intraday support/resistance levels for stock traders (Opening range, morning H/L, yesterday H/L, Weekly H/L, daily SMA/EMA). Colors, styles & width are customizable. Users can also define which elements to display including levels for past days.
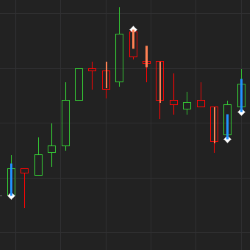
The Epic U-Turn indicator is based on volume & previous price action to confirm that power has switched from buyers to sellers. For intraday or swing trading, these are also known as reversal bars, turnaround bars or engulfing reversal patterns. Strategy supports algo-trading. Download a free trial!
StockAlgo is a cutting-edge trading signal app tailored for NYSE stock traders, delivering accurate signals for NYSE stocks. Benefit from a 3-day free trial to test its reliability. Available on both iOS and Android, StockAlgo equips traders with timely insights to make informed decisions.
Power Wicks, utilizing Volume Profile and Order Flow, provides a comprehensive analysis of buying and selling dynamics within each bar. It carefully examines market imbalances and plots a wick from the High to Low, extending to the intra-bar VWAP whenever a significant imbalance or a shift occurs.
Trading coach with volume and price indicators.
Time Or Range is a custom bar type with intervals at a predetermined elapsed time span OR price action range.
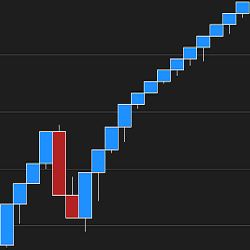
Say goodbye to fixed brick sizes! Optimal Renko Bars' advanced logic auto-selects the smoothest-fit Renko bars for your chart in real time! Dynamic, self-adjusting bar type that responds to today's market.
December 2, 2024
Mastering Sideways Markets With Auction Bars and Range Projections
November 19, 2024
Enhancing Your Automated Trading System: Key Insights from Best Pro Trade
November 14, 2024
NinjaTrader New Ecosystem Tools: October 2024 Edition
Enter Email for Updates