Automatic Trailing Stop works with futures, forex, stocks, ETFs. The system includes easy to use visual automatic trailing stops. It's easily adjustable for various market conditions, and works with any chart type. Get a free demo session!
Earl's ultra-configurable HAMA indicator not only smooths out price data, but it excels at helping you spot divergences and leading momentum swings with an "RSI Filter" setting. Trade with more confidence and less hesitation with the included Trend Trigger indicator to help time your entries.
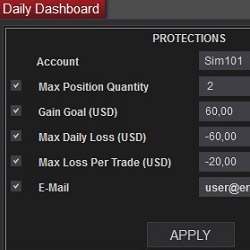
Protect your losses in a trade and daily basis. Do not grow a position more than planned. Daily Dashboard is the tool to support you against your bad behavior in the stressful moments.
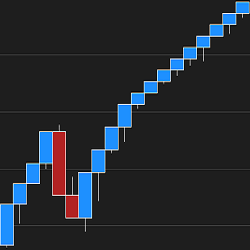
Say goodbye to fixed brick sizes! Optimal Renko Bars' advanced logic auto-selects the smoothest-fit Renko bars for your chart in real time! Dynamic, self-adjusting bar type that responds to today's market.
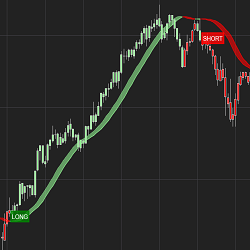
The HolyGrail Algo uses calculations of the Hull Exponential Moving Average to identify market direction. A long or short condition is printed on the chart and the strategy executes the trade by going long or short. You can set defined take profit, stop loss and trail and time of day to trade.
Ready to level up your trading? Tune in to the Smarter Trading Podcast to hear from professional traders. From quantitative to fundamental, day traders to trend followers, they share practical advice, tips and insights on investing in the stock market.
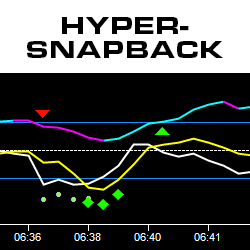
Based on an exclusive algorithm, the HyperSnapback indicator reads anomalies in price that are often difficult to spot in the market. It looks for specific predictive signals and offers trade management guidance. Get the HyperSnapback Indicator now!
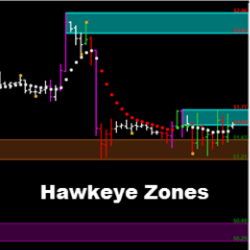
Hawkeye Zones add extremely accurate, predictive supply and demand zones (support and resistance) on your charts. Visualize market turning points and break out areas in all markets and timeframes. Buy now using code: “NT10Off” for a 10% discount.
Since 2005, Whitmark Development is a full-time, US-based NinjaScript consultant that offers custom coding services with special expertise in fully-automated strategies, delivering innovative solutions for traders and vendors with full-service support. Call or Email for a project consultation!
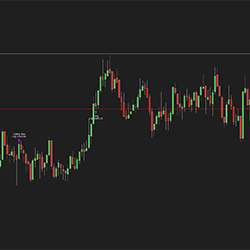
Bold Bot is a strategy for NQ which will analyze the product for long trades.
March 25, 2024
Trading Pullbacks and Reversals: Simplifying a Once Complex Retail Trading Strategy
March 21, 2024
VWAP Indicator: Average Price Shown Based on Price, Volume
March 18, 2024
Trade Copier Strategies: Make Efficiency Work for You When Futures Trading
Enter Email for Updates