Learn to code automated strategies, indicators and add-ons for NinjaTrader 8. Join our NinjaScript custom programming course. No prior programming knowledge is required. Learn from beginner to expert level in live sessions tailored for custom NinjaScript programming.
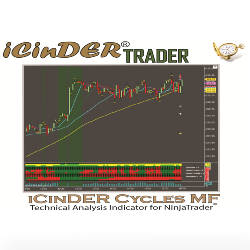
The iCinDER™ MF (Market Forces) includes all of the iCinDER™ family of indicators as part of a complete set. The analysis is based on internal market force of the instrument being analyzed. Learn more!
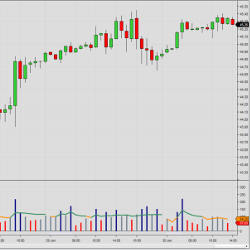
The Relative Volume indicator identifies high/low volume bars by comparing current volume against the average volume over the same period during the preceding days/weeks.
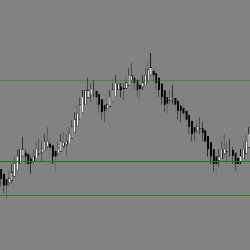
The EPyFSwingLevels indicator identifies the most relevant structure levels. Once the indicator is loaded within a chart, it automatically reflects areas where the price reacts.
Anchored VWAP: A dynamic tool for trading strategies. Coding friendly: One of the standout features of the Anchored VWAP is its coding friendliness. Users can seamlessly integrate it into the code of any NinjaTrader strategy, allowing for easy implementation and customization.
Creating custom algorithmic trading solutions that provide out of the box edge.
Securely access NinjaTrader desktop from any device, any location. Host your NinjaTrader desktop application on a VPS to improve the application’s accessibility, security and flexibility. Please mention NinjaTrader in your registration (problem) for advanced support.
Discover top trading opportunities for US stocks, Wyckoff method analysis in US indices futures, Gold, Silver, market internals, and more to look for “time sensitive development” trading opportunities. Discuss your trading plans and past trade reviews to sharpen your price action trading skills.
Douro Day Trading indicators are specifically designed for five minute chart trading targeting the European open, US premarket, US open and US. They are also designed for 5 minute, 15 minute and 60 minute combination trading, and produce up to 60 valid trades in a 24 hour period.
Would you like to access planning charts from the top retail traders in the industry which could help you become a more consistent trader regardless of whether the market is trading up, down or sideways?
December 2, 2024
Mastering Sideways Markets With Auction Bars and Range Projections
November 19, 2024
Enhancing Your Automated Trading System: Key Insights from Best Pro Trade
November 14, 2024
NinjaTrader New Ecosystem Tools: October 2024 Edition
Enter Email for Updates