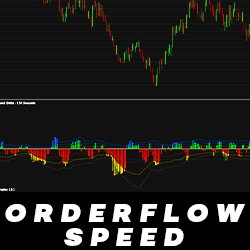
Deceptively simple, Orderflow Speed allows you to monitor market speed and enables you to view trading activity directly from your chart. It supports the Tick Replay feature so that you can visualize historical trading activity.
PortfolioPilot is your personal AI financial advisor, powered by Global Predictions' award-winning Economic Insights Engine. It offers a free portfolio tracker and financial advice tailored to your needs. With this tool, sophisticated financial strategies become accessible to every investor.
This trading indicator is the ultimate “go/no-go gauge” for any trading strategy. A sub-chart that looks up six timeframes and gives real-time BIAS. Bullish, neutral or bearish on each level. Making decisions and acting on trading signals made easier!
The "Qdirector" is a scalping indicator built to catch explosive movements in price. Easily see high & low momentum periods as the indicator "directs" traders to scalp in strong price moving environments. Traders can adjust the indicator settings to be more or less responsive to price action.
Securely access NinjaTrader desktop from any device, any location. Host your NinjaTrader desktop application on a VPS to improve the application’s accessibility, security and flexibility. Please mention NinjaTrader in your registration (problem) for advanced support.
Automated trading for the S&P 500, Indices, ETFs, Stocks and Cryptocurrencies. Discretionary trading indicators. The RD3 uses a two stage system for identifying profitable swing trading opportunities.
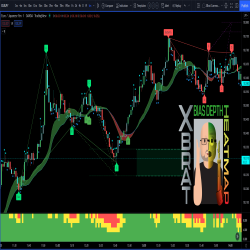
CB ZoneChart V5.0 update was just released. It now comes with turning bars included to help gage the tops and bottoms or turns in the market. Also includes the opening ranges, zigzag support and resistance, golden zone Fibs, and the most requested blue dotted lines support and resistance.
Take advantage of IndicatorSmart’s special discounts for NinjaTrader Ecosystem users. Be sure to sign up for their Members List on their site for even more special offers and to stay informed about important trader events.
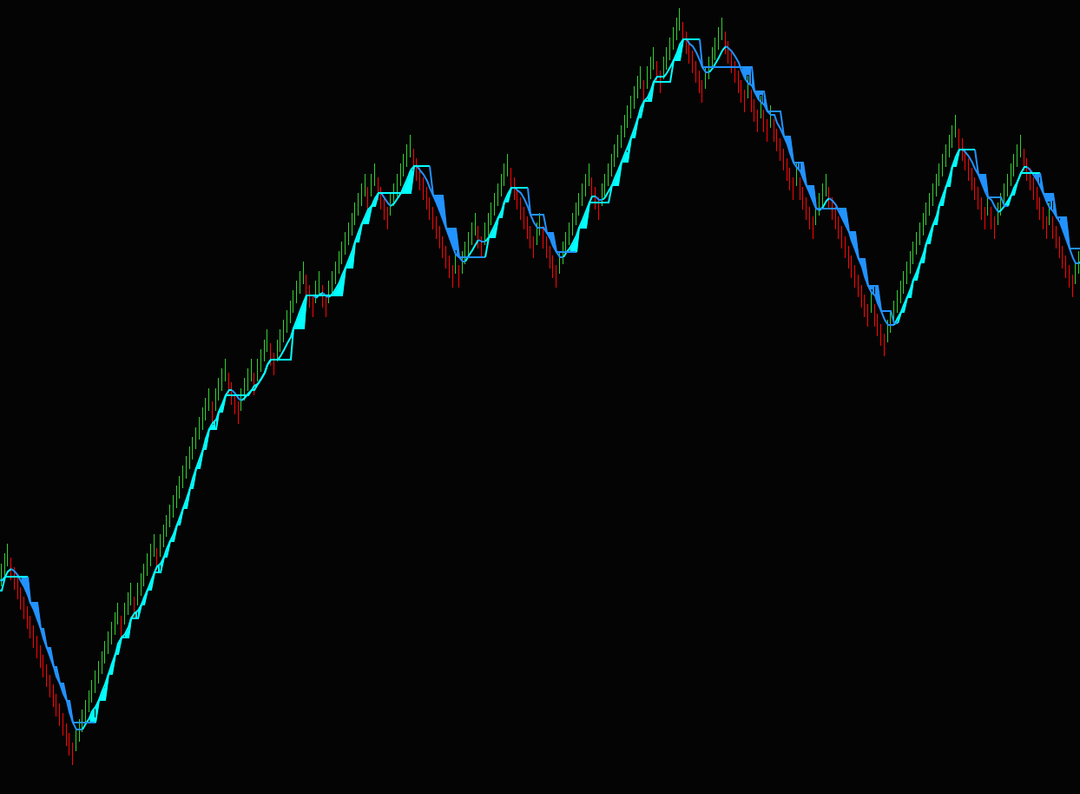
STBars are Structural Trading’s custom range and renko bars which include the STRangemanker, a tool identifying for support, resistance and trend bias. The STBars are available in NinjaTrader 7 and NinjaTrader 8. Learn more!
PFAHedger is an innovative addon to the PFAZoneSuite supply & demand indicator, providing the ability to submit hedging positions on any market. Simultaneously submit trades on any market while submitting hedge orders on another market, directly from the same chart.
December 2, 2024
Mastering Sideways Markets With Auction Bars and Range Projections
November 19, 2024
Enhancing Your Automated Trading System: Key Insights from Best Pro Trade
November 14, 2024
NinjaTrader New Ecosystem Tools: October 2024 Edition
Enter Email for Updates