This automated trading strategy for NinjaTrader 8 does not need any adjustment and is ready to be used out of the box. Newly created & designed for the Micro E-mini S&P 500 futures market, it has been thoroughly backtested over many weeks and is fully-functional.
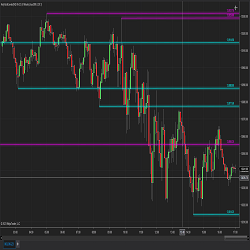
Q-PZone provides visual naked volume point of control (VPOC) zones. These VPOC zone levels are significant because they can act as a support or resistance level.
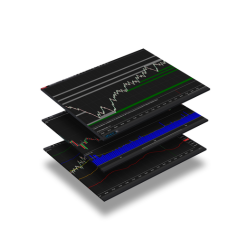
Our Futures Trading Package includes pre-built workspaces, chart templates and Market Analyzers with scanners and alerts. Use ATS Chart Trader for trade management, use VPOC charting and trading with 10 days VPOC plotted, and find trade setups with DTS Ichimoku Cloud pattern. Learn for free.
This algorithm calculates the support and resistance based on a look back period (number) of candles or bars and determines the support and resistance levels dynamically.
PriceIsKing.com's Stocks RAM Indicator is a powerful tool based on years of research and testing that shows equities traders entry points with arrows when the right condition is met. Get started with a free 2-week trial today!
Emet Trading Solutions is a team of experienced programmers focused on coding custom automated trading strategies and indicators. The programmers at Emet Trading Solutions can turn trading ideas into fully automated systems and provide ongoing technical support. Get a free quote for your project!
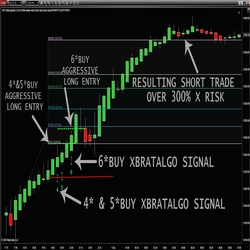
Think of an experienced trader’s brain as a blueprint for a trading algorithm. Then, add the desire to keep charts as clutter-free as possible. Nine decision points defines a 3* trade, 10 decision points makes it a 4* trade, 11 decision points for a 5* trade and 12 decision points for a 6* trade.
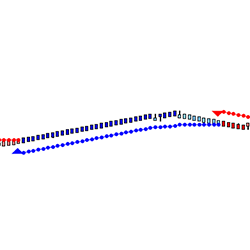
A precise analytical tool derived from statistical trading metrics such as prices and volume, offering insights to inform trading decisions.
This basic indicator is simple but very powerful. It provides an entry, stop and trailing stop. Knowing when and how to employ this indicator is taught in the trading room.
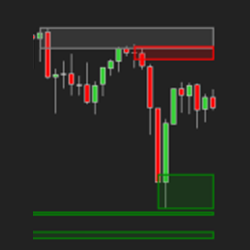
If you've never considered support and resistance from the perspective of volume – think again. Light volume regions indicate price action passing through and a great signal for continuation of trend. High volume suggests a pause point. Just what you need to know in advance. So, grab yours now!
December 2, 2024
Mastering Sideways Markets With Auction Bars and Range Projections
November 19, 2024
Enhancing Your Automated Trading System: Key Insights from Best Pro Trade
November 14, 2024
NinjaTrader New Ecosystem Tools: October 2024 Edition
Enter Email for Updates