This intelligent indicator uses three different metrics to confirm trend strength so that you can plan your trades with greater confidence. It pinpoints precise moments to enter trades. 1-2-3 Strike! has innovative features like smart signals, performance statistics and attractive visuals.
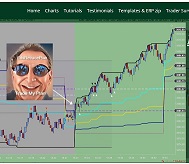
EdsRetracePlan with Markers Plus added is a simple to use single indicator system for Ninja 8. Using 3 to 5 range charts, you can automate CL, NQ and GC trade entries by turning on Markers Plus. Trades will be taken using the long or short signals generated by ERP and then managed by Ninja 8 ATM.
Introducing Core Buttons, the ultimate trading tool for split second decision making. These intuitive buttons provide instant access to essential trading functions, enabling you to execute trades, manage positions & adjust orders with a single click. Tailor the customizable options to your trading.
A traditional Gann Fan with 5 next-gen features to give your Gann analysis a new edge. This multi-timeframe Gann fan is what WD Gann himself would have created if he existed in today's fast paced digital landscape. A must to find support and resistance, real-time price momentum & geo signatures.
Master quantitative trading with our courses. From back-testing basics to advanced strategy development, learn to build systematic trading systems. Explore futures, pairs trading, & essential Python programming tailored for financial markets. Gain a trading edge with real-world examples. Enroll now!
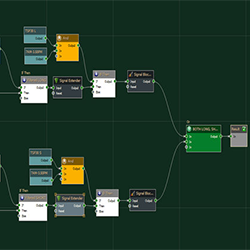
Custom strategy design in BloodHound. Remek! will program your trading strategy as per your specifications and requirements. Learn more!
Is it a trend or a movement? Trend Ribbon uses one color to indicate an uptrend and another to indicate a downtrend. The ribbon shows trend strength and the transition of direction when the ribbon narrows and “flips.” Fully adjustable to your style and timeframe: day, swing or longer trading.
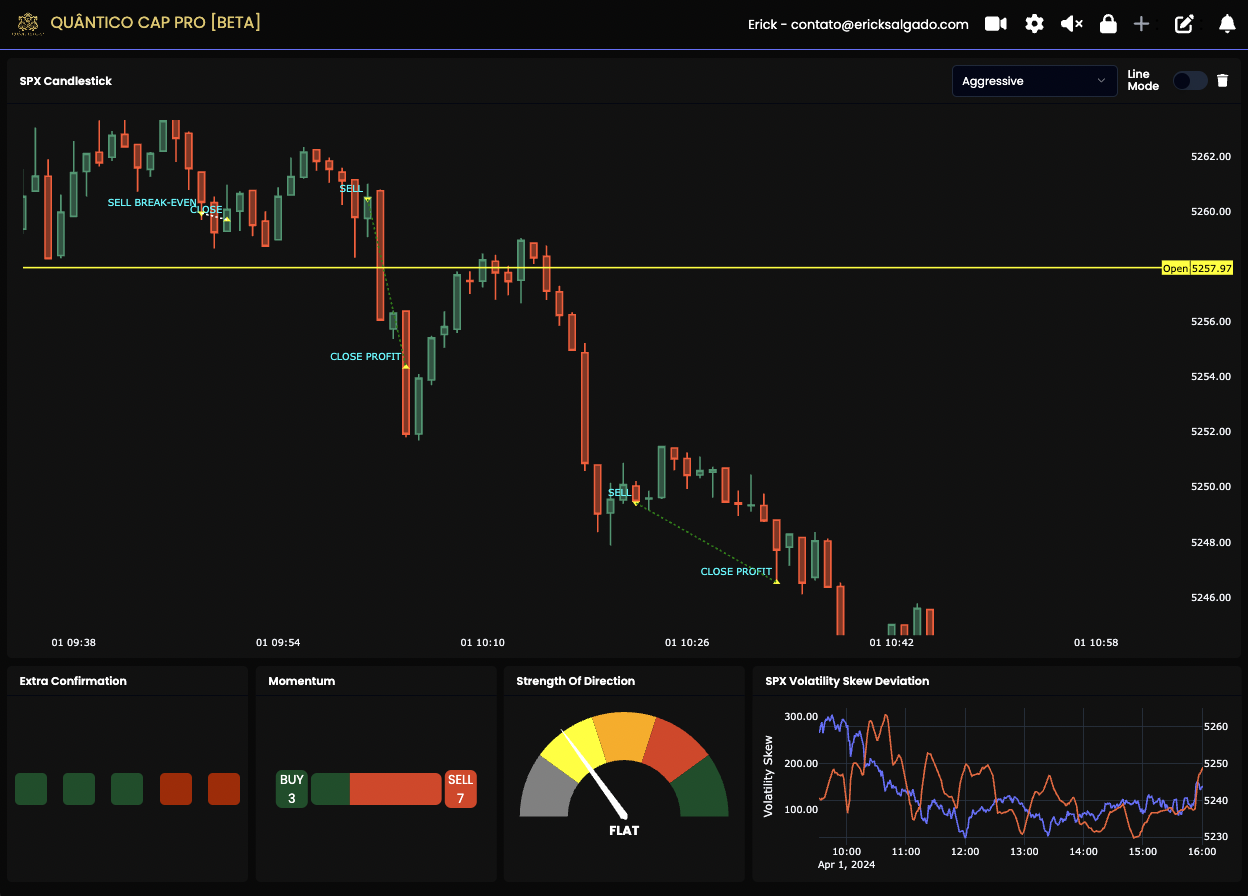
Access clear buy and sell signals tailored for trading precisely when our algorithm detects market maker interventions. Exclusively offered for ES and NQ, seize the opportunity to join our community of hundreds of traders already leveraging 0DTE and Market Maker setups.
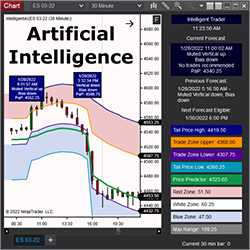
Intelligent AI uses a proprietary AIFS platform (Artificial Intelligence Forecast System). AIFS models are trained to learn the underlying structure of the market to forecast what may happen over the next six hours. Subscriptions also include access to Intelligent Trader's moderated Discord channel.
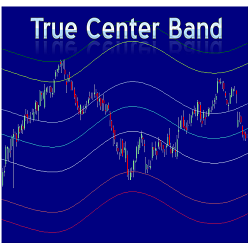
The True Center Band (TCB) indicator shows the trend, different levels of support and resistance and the boundary of price action. The TCB is designed to work on all intraday and daily charts as well as any market.
December 2, 2024
Mastering Sideways Markets With Auction Bars and Range Projections
November 19, 2024
Enhancing Your Automated Trading System: Key Insights from Best Pro Trade
November 14, 2024
NinjaTrader New Ecosystem Tools: October 2024 Edition
Enter Email for Updates