Your mindset can make or break your trading account. It's your mindset that determines whether you execute your trading plan or break your rules. Go Deep to Level Up Your Trading™ is the most comprehensive trading psychology course on the market. Join now.
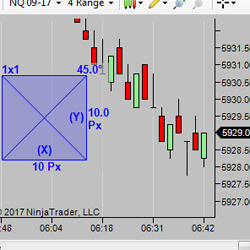
This tool is a valuable visual aid for traders who use Gann, Fibonacci, Point and Figure charts and want to see true angles. Simply load it on the chart and push the toolbar button when you want to use it, then adjust an axis until the chart is square. Using the 'Keep Centered' option will then keep price in the chart area while the chart is squared.
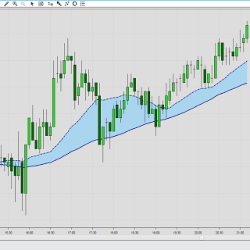
The Multiple MA Cross indicator plots a fast and a slow moving average. For both averages, users may select from over 30 different algorithms. The indicator can be used as a trend filter or for determining support and resistance.
Unlike typical indicators that often succumb to false breakouts, Trendline Autom@ton eliminates such errors, with trendlines extending until a genuine breakout occurs as defined by the user. The indicator supports an unlimited number of trendlines, providing a detailed view of price dynamics.
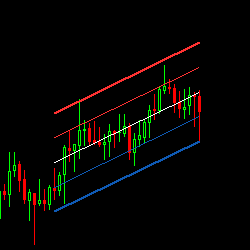
The Linear Regression Channel (LRC) trading indicator gives objective buy & sell signals based on price volatility. The upper and lower channels (linear regression lines) can be used to enter & exit the market in potential reversal zones. Add this to your chart today.
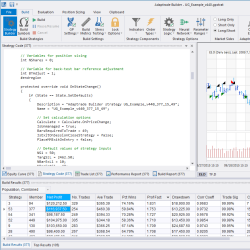
Developing automated trading strategies can be time consuming and difficult. Adaptrade Builder is an advanced trading strategy generator that will quickly find, code and test unique and complete trading strategies based on your requirements. Start building strategies today with a free 30-day trial!
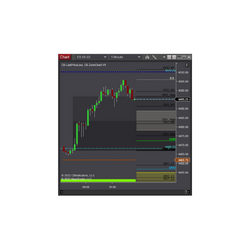
CB ZoneChart V4 is a longer-term day trade indicator that shows support and resistance, fibs and opening range areas. It has many settings and has been updated over the years (since 2016). Combining it with the other CB Indicators makes a great combo. Try it out with a 14-day free trial!
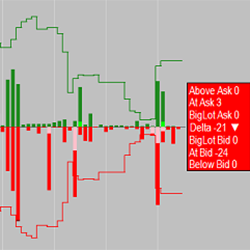
Use the Tape? Time & Sales can be hard to follow; however, this indicator boils it down to an easy to read histogram. Easily see the bid & ask trades, above ask & below bid trades, BigLot trades, the delta bid/ask ratio and much more. Learn more about the BigLotHistogram indicator now!
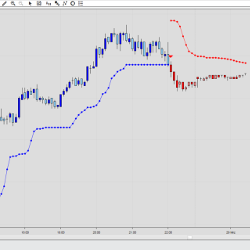
The SuperTrend U11 is a stop and reverse (SAR) indicator that trails price action. The trailing stop adjusts to both trading prices and volatility. When volatility is high, the trailing stop is further away from prices. When volatility is low, the trailing stop moves closer to prices.
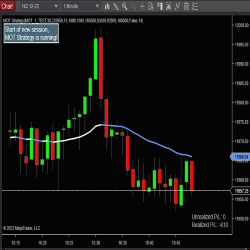
MightyOxTrading Strategy is an automated trading strategy for NinjaTrader 8. It has the option to use higher-timeframe bars as a filter for potential trades. It uses an ATM strategy for order management, so you can configure it for a single contract or for multiple contracts using a "runner".
December 2, 2024
Mastering Sideways Markets With Auction Bars and Range Projections
November 19, 2024
Enhancing Your Automated Trading System: Key Insights from Best Pro Trade
November 14, 2024
NinjaTrader New Ecosystem Tools: October 2024 Edition
Enter Email for Updates