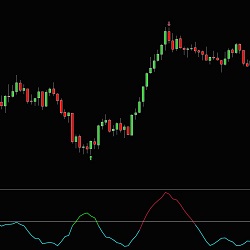
The MCumulativeDelta Indicator shows the bid / ask volume displayed in a histogram over a period. It serves to determine whether supply or demand is dominating and in control and the buying / selling pressure.
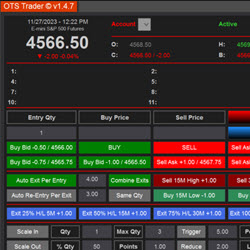
Uniquely streamlines your daily trading tasks, automating processes that would otherwise require manual effort. Organized into four key sections — first entry, second entries, auto stops and auto exits. Plus more.
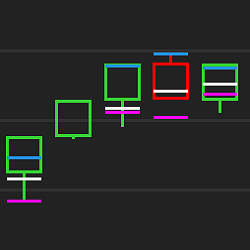
Are you using Renko/range/tick/volume bars? Optimal Tempo shows you the high/low/close of time-period bars overlaid on your chart. Choose any time period you wish. See five-minute bar levels overlaid on a Renko chart! No need to watch other charts. Strategy compatible.
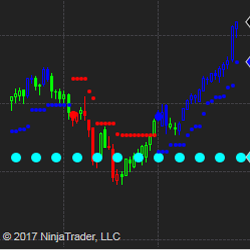
Side-Bias Indicators include intelligent moving averages and a trailing stop indicator for NinjaTrader. Included are 3 proprietary calculations that track price very accurately yet smoothly, offering stunning support and resistance levels. They pick a side to stick to price while avoiding whipsaws.
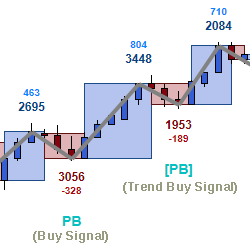
If you seek a trend-following system capable of minimizing failed entry signals in choppy markets, your search ends with RK-System Platinum v4. This system provides up to 4 signal types, with the price action signal type proving to be particularly reliable and productive in our backtesting.
This is an automated trading strategy that is designed to trade ES futures.
AbleTrend offers a time-tested color-coded trading system featuring dynamic support and resistance indicators that produces buy, sell and exit trade signals. It can be used on any timeframe in the stocks, futures and forex markets. Get started with a 30-day trial for $79 today!
A cutting-edge indicator designed to make order flow trading both effective and enjoyable. Featuring an intuitive footprint chart, it provides valuable insights into historical and real-time market activity. The footprint chart reveals buy and sell volumes and order flow within each price bar.
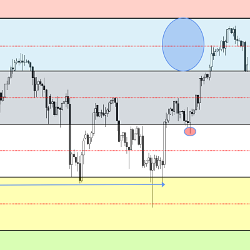
The E-widget is a suite of tools like a Swiss Army knife, offering customizable analytical solutions for traders. Use E-mini Wizard preset templates for Fibonacci levels, support & resistance, risk:reward ideas, regression trades, or build your own. E-widget is designed to work on all markets.
Peaks is a powerful market indicator meticulously designed to identify precise tops and bottoms of price movements. Using sophisticated analysis techniques it pinpoints potential reversal points in the market. Peaks empowers traders to optimize entries & exits, making trading decisions confidently.
December 2, 2024
Mastering Sideways Markets With Auction Bars and Range Projections
November 19, 2024
Enhancing Your Automated Trading System: Key Insights from Best Pro Trade
November 14, 2024
NinjaTrader New Ecosystem Tools: October 2024 Edition
Enter Email for Updates