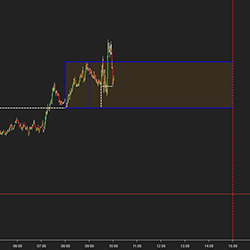
Add the visual benefit of displaying the session open value (settable). Build a visual range of any timeframe you choose. For example, the first 30 minutes of the market open or an hour before the market opens. Choose the end time for a range to stop displaying for the day.
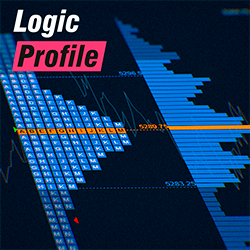
Includes volume profile and TPO market profile, presets for one-click charting, daily, weekly, monthly, date, composite, and drawn profiles. Offers defined or continuous session types and load optimization. All of these features make it one of the most advanced profiles available on the market.
Volume Profile is a very well-known and very much-used indicator in trading, but with a twist! Our indicator will give you the ability to automatically anchor it to various starting points and, better yet, use it in your automated strategies and backtesting.
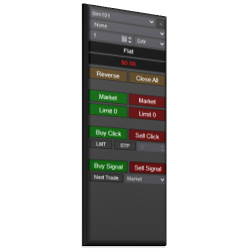
The Signal Entry Orders indicator allows traders to click a button that initiates logic to submit orders immediately on the close of a bar, as soon as a signal occurs. This removes unnecessary stress and challenge when entering orders.
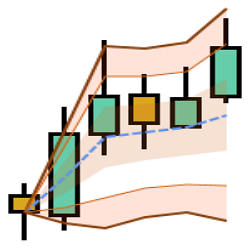
DrawCator VWAP is a feature-rich drawing tool which plots VWAP (+SD Bands) by mouse drag-n-draw on custom start & end points. New Attach and Roll modes provide auto updating and forwarding with live markets. Alerts, Ninjascripting, Strategy & Market Analyzer and 1-Click draw are all supported.
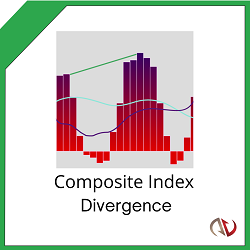
See trend reversals before they happen with intelligent divergence signals! Predict the trend ahead of the crowd with precise entry and exit points. This innovative indicator uses momentum calculations to warn of trend reversals before they happen!
Know that you’re an amazing trader but finding the funds to get started is the one thing standing in your way? At UProfitTrader, we can help! Simply choose the size account you’d like, show us what you’ve got through our unique testing process, then start turning your passion into a profession.
Providing a monthly service to this trading algorithm, SpartanBot. It is a trading algorithm that focuses on momentum trading, and follows a good risk management.
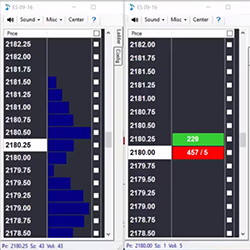
PriceSquawk empowers traders with an audible market perspective of order flow and price action across asset classes, giving traders the focus needed to respond to leading market information. Monitor markets via the customizable squawk feed, T&S trade sounds and order flow alerts.
Streamline your trading with semi-automated tools that efficiently manage positions, whether long or short, across specific instruments in your account.
December 2, 2024
Mastering Sideways Markets With Auction Bars and Range Projections
November 19, 2024
Enhancing Your Automated Trading System: Key Insights from Best Pro Trade
November 14, 2024
NinjaTrader New Ecosystem Tools: October 2024 Edition
Enter Email for Updates