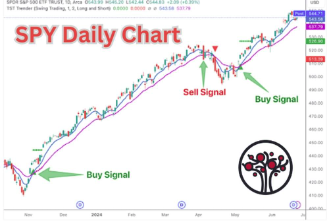
Serge Berger’s TST Trender indicator is designed to provide buy/sell signals at near-term turning points in stocks, ETFs, and futures. At its core, it uses a moving average crossover strategy with specific moving averages that have proven to work best on the daily charts (for swing trading).
This system will take you through the process of how to "risk 1 to make 2" that professional traders utilize to increase their profitability and have consistent months, quarters and years. The system incorporates philosophies found in "Trading in the Zone" by Mark Douglas.
The purpose of this indicator is to automatically plot critical support and resistance levels on a chart. The Critical Support & Resistance Level Indicator comes with customizable alerts and can be added as a Market Analyzer column.
PureMO & ScalpMO: The ultimate combo for momentum and scalping mastery. Track momentum, dominate scalping. Two cutting-edge tools in one package, built to transform your trading. Try it free for 7 days and see the difference!
DiNapoli Levels are a combination of leading and lagging indicators providing predefined entry levels, reasonably tight stops, and precalculated profit targets. This package includes the Auto Fibonacci Retracement tool, proprietary Oscillator Predictor and all new MACD Predictor with video demos.
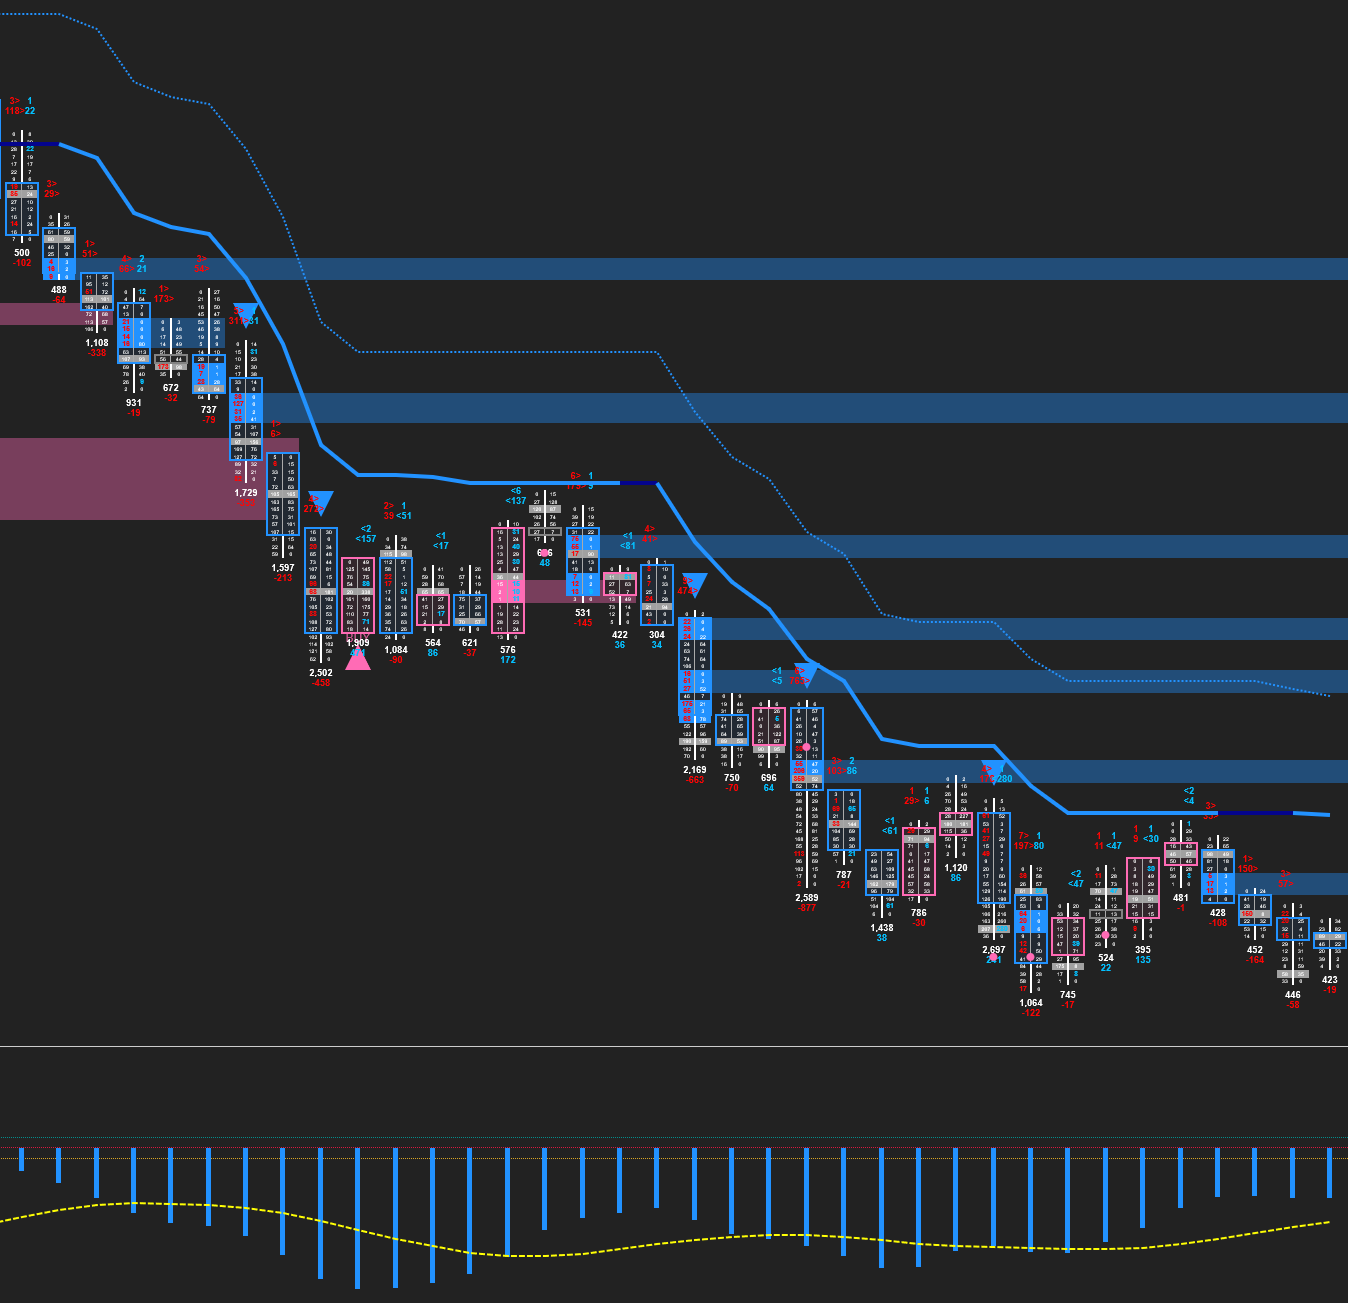
China Market Data, Order Flow
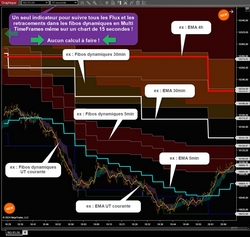
This indicator will calculate for you in multi timeframe: 4 EMA MTF + 4 “SunjoKu” MTF, the famous indicator invented by Joël Mathieu the boss of Intrad. Since version 1.5: A summary table of the status of the different TimeFrames has been included.
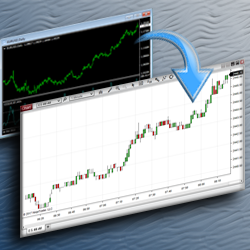
More Tech, LLC has over 10 years of experience working with MetaTrader, and have converted hundreds of indicators and strategies to be compatible with the NinjaTrader platform. Contact them today to receive a free estimate for having your code converted from MQL to NinjaScript.
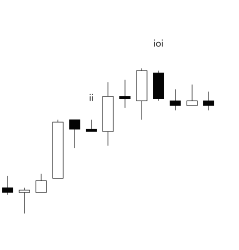
Breakout Mode Patterns from Brooks Price Action methodology.
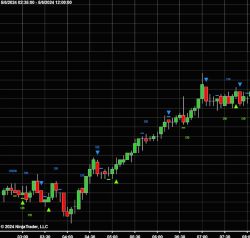
The Turn Around Signal indicator can locate and label locations of reversal / turn-arounds in price action. When combined with the proper retracement, this signal can produce great results by identifying directional changes and pullbacks. Also identifies and labels Double Bars, Doji’s and Pinbars.
December 2, 2024
Mastering Sideways Markets With Auction Bars and Range Projections
November 19, 2024
Enhancing Your Automated Trading System: Key Insights from Best Pro Trade
November 14, 2024
NinjaTrader New Ecosystem Tools: October 2024 Edition
Enter Email for Updates