Get Integrated Basic and Advanced Training in a full-year trader development program. This program includes access to live online Basic and Advanced Training events in addition to on-demand learning modules. Designed for those who can commit to 1-3 hours of trader development per day.
A semi-automated strategy that uses the previous days Fibonnaci range and an EMA to enter and exit trades.
Specializes in developing add-ons, indicators and automatic strategies for the NinjaTrader trading platform. With these innovative solutions, they help traders enhance their trading strategies. DevNT is formed by traders and they use their experience in the market to help you to shape your solution.
The Pyramid Bundle is a great value and contains our entire collection of current and future indicators. As an owner, you'll never pay more for premium support, upgrades or new product releases. Receive instant access to our entire collection of indicators with a free 14-day trial!
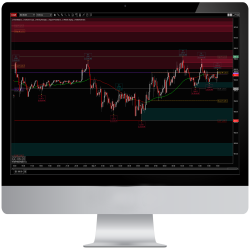
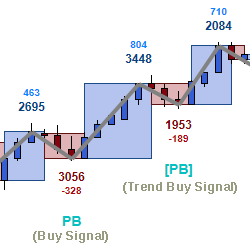
The Atlas Line begins plotting soon after the market opens. As it grows throughout the day, you will see entry signals (long and short) as well as supplemental "strength" and "pullback" signals. Many traders use the Atlas Line for its powerful signals and a big picture of anticipated price action.
The MCumulativeDelta Indicator shows the bid / ask volume displayed in a histogram over a period. It serves to determine whether supply or demand is dominating and in control and the buying / selling pressure.
Learn order flow trading from experienced full-time traders. We meet live multiple times each week - all meetings, clinics and workshops are recorded to our members library and you can interact 24x7 in our Slack group. We’re 100% focused on consistent trade setups and a FURU-free zone!
Order Flow is the study of tick-by-tick volume for trading Futures, Forex and Equities. The OFA toolset provides custom charts and advanced drag-and-drop profiling features designed to easily identify precision entries and targets. Get started with a free order flow training class today!
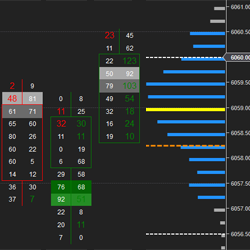
100% FREE - The TAS Market Map Indicator delivers the most visually appealing customizable market profile tool for traders. Its color-coded sideways histograms clearly reveal volume at price, value areas (red zones), master point of control lines (aqua lines), gaps and congestion.
Visit our website, leave your e-mail address and get our document for free!
December 2, 2024
Mastering Sideways Markets With Auction Bars and Range Projections
November 19, 2024
Enhancing Your Automated Trading System: Key Insights from Best Pro Trade
November 14, 2024
NinjaTrader New Ecosystem Tools: October 2024 Edition
Enter Email for Updates