This is an intensive one-week course that by the end of the week will have you making confident trading decisions on various asset classes. If you have an inner trader we will find it. This course also includes a free trading challenge to qualify for a funded trading account.
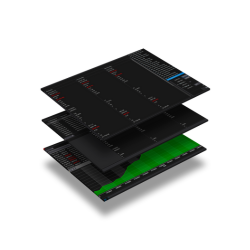
Denotes fitness functions in the NinjaTrader 8 platform, evaluating trading strategies' performance. By leveraging specific parameters, they assist traders in analyzing, comparing and selecting the most effective trading methodologies.
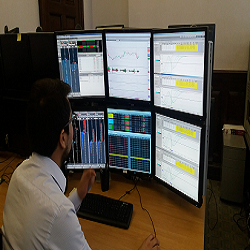
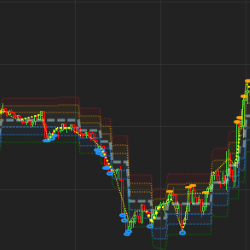
With Liquidity IQ, you have a personal "Technical Analysis" trading assistant by your side, dedicated to highlighting critical trading levels and trends. And the best part? It works continuously, updating in real-time as the market changes.
When MFI, RSI, and Stochastic converge, the background is colored, signifying the overlapping zone and triggering immediate alerts via chart markers. This visually appealing and efficient tool excels beyond conventional oscillator applications, optimizing chart space for essential information.
Kase StatWare indicators are self-optimizing, and dynamically adjust to market volatility across multiple bar lengths. StatWare’s momentum based indicators identify trend direction and strength, precise entry and exit points, and optimal stop levels to control risk. Take a free 30-day trial today!
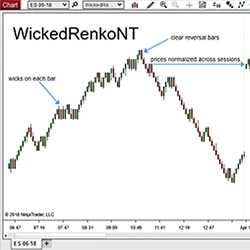
WickedRenkoNT is a custom Renko bar type which is easy to see & logical to interpret. Adding WickedRenkoNT bars to yourchart is extremely helpful in filtering noise on a chart, as well as identifying reversals. Additionally, these bars remove erroneous gaps and align bars across sessions.
This indicator tracks the Smart Money flow in the market. Following the Smart Money provides a better understanding of the volatility size and trend direction. Ready to see what the Smart Money is doing?
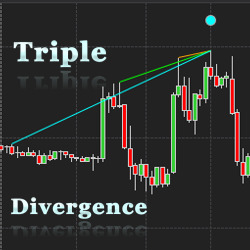
When three continuous divergences occur the WilliamsR Triple Divergence Indicator will trigger an entry signal at the current bar. This indicator integrates with NinjaTrader’s market analyzer and indicates either bullish or bearish divergence at x number of bars ago.
Learn from 25+ chapters that take you from A-Z, showing traders three go-to entry signals that are seen on all time frames. Join for lifetime access, yearly updates, VIP Discord access, live morning analysis stream, and more!
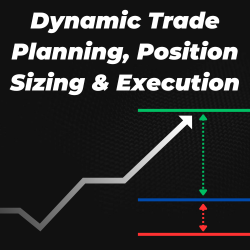
Plan & manage your trade with draggable entry, take profit, & stop loss levels. Auto-calculate & execute position size based on risk management parameters (fixed dollar, % balance, fixed contracts). Includes fixed risk reward, move to breakeven & max contracts features–the all-in-one trading tool.
December 2, 2024
Mastering Sideways Markets With Auction Bars and Range Projections
November 19, 2024
Enhancing Your Automated Trading System: Key Insights from Best Pro Trade
November 14, 2024
NinjaTrader New Ecosystem Tools: October 2024 Edition
Enter Email for Updates