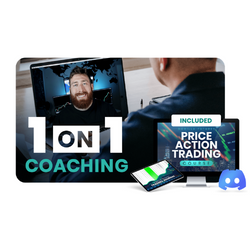
This 25+ Chapter Price Action Course plus 4 one-on-one hour long help sessions are designed to address trading hurdles you may be facing. This Couse Includes access to VIP discord, daily morning livestream, lifetime access to the course, and more!
Visually add buying and selling pressure analysis and time & sales data to any chart. See the pace of the tape and order flow analytics in an easy to understand tape speed monitor format that allows you to quickly read the tape. The Geiger Counter is an instantaneous indicator of order flow shift.
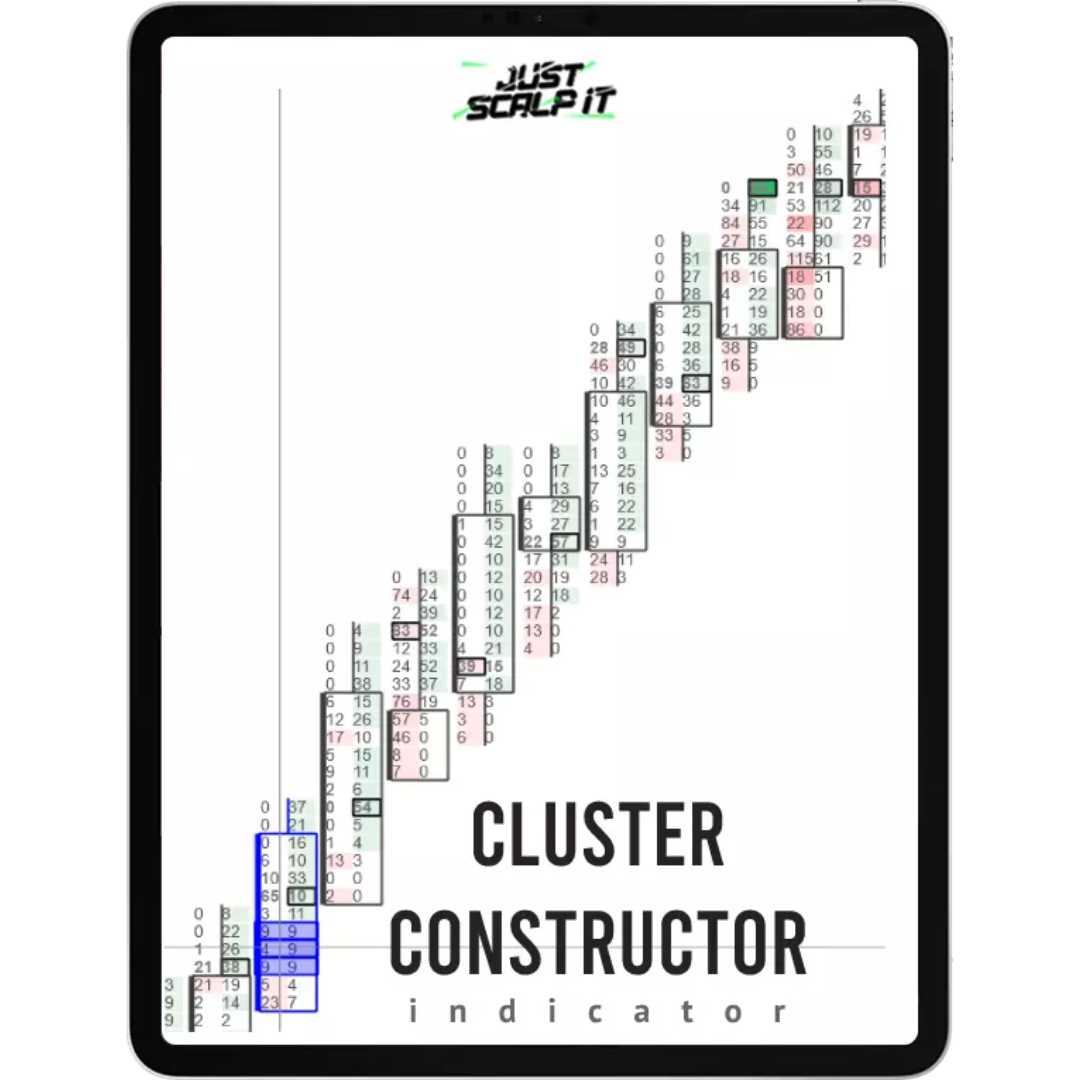
Explore the advanced order flow indicator, Cluster Constructor, featuring 16+ filters for deep market analysis (footprint charts). Ideal for unveiling smart money and institutional trends, enhancing order flow trading strategies. Delve into sophisticated insights – start now!
Our Partner Programmer service is ideal for traders with great ideas and a limited budget. We help code your ideas and instead of paying for the programming service, we enter a joint investment agreement.
ApexAlgo is a cutting-edge AI trading indicators powered by ApexA.I. It delivers precise market signals for informed trading decisions. The latest update introduces confirmed signals, enhancing your trading strategy like never before.
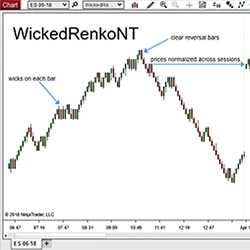
WickedRenkoNT is a custom Renko bar type which is easy to see & logical to interpret. Adding WickedRenkoNT bars to yourchart is extremely helpful in filtering noise on a chart, as well as identifying reversals. Additionally, these bars remove erroneous gaps and align bars across sessions.
This is an excellent indicator in the S/R family. It was made with swing points, the visual concept of Market Profile, and their proprietary algorithm. The final result is a tool that can find outstanding S/R zones. It helps traders traverse the market, much like a radar helps a plane navigate.
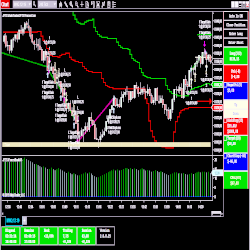
JTFS AutoTrader is designed for both discretionary & fully automated trading with a highly-customizable & easy-to-use interface. This strategy includes risk control, entry signals, manageable trailing stop & gain, target by ticks, sound alarms and more.
Know that you’re an amazing trader but finding the funds to get started is the one thing standing in your way? At UProfitTrader, we can help! Simply choose the size account you’d like, show us what you’ve got through our unique testing process, then start turning your passion into a profession.
The Ultimate Pivot Points™ (UPP) Indicator Package is the most advanced and extensive collection of “Pivot Points” Indicators available. It includes every “Pivot Point” method along with several innovative features — making it one of the most complete Support/Resistance indicators on the market!
December 2, 2024
Mastering Sideways Markets With Auction Bars and Range Projections
November 19, 2024
Enhancing Your Automated Trading System: Key Insights from Best Pro Trade
November 14, 2024
NinjaTrader New Ecosystem Tools: October 2024 Edition
Enter Email for Updates