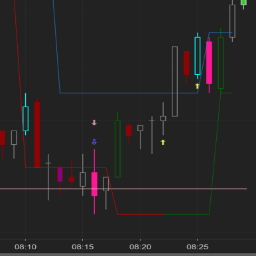
The SDP History offers multiple ways for the user to visualize the aggressive auction from session to session and monitor for continuation (Leroys) and turning points (Elbows).
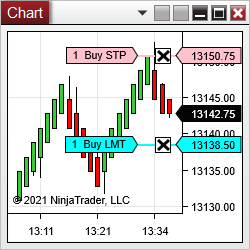
Clicker allows one to enter orders with one click directly on the chart! Modifier keys and mouse buttons for buying and selling are configurable. The order type is detected from the clicked price relative to the market price. All order parameters come from ChartTrader. Free trial for seven days.
You can now calculate how liquid a symbol is based on its trading activity and filter out risky instruments. A higher no of trades a day would mean that the instrument is drawing attention. Start using this powerful screener tool in your market analyzer today!
Let us help you automate your indicator or strategy! Our custom programming service provides automation for indicators and automated strategies.
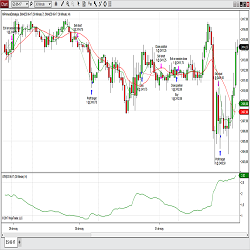
Simplify your trading with my strategy: trend, price action, support/resistance and momentum. Green/red bars indicate trend, custom ExCon indicator manages setups, pivots show support/resistance and MACD ties it all together. Clear entries, take profits and exits with simple rules for engagement.
David Misselhorn is a software developer with over 30 years of development experience in trading clients, market data and order-execution software. He writes indicators and strategies for individuals wishing to automate their trading and analysis activities.
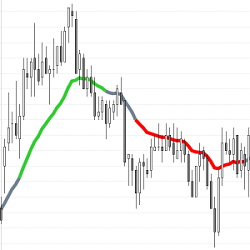
This indicator uses recent bar closes to calculate the “Always In” direction to help traders determine market trends. Use the Simple Always In EMA as a discretionary indicator or for automated trading. It is FREE to download and use!
This basic indicator is simple but very powerful. It provides an entry, stop and trailing stop. Knowing when and how to employ this indicator is taught in the trading room.
The Spread Trading Tool add on for NinjaTrader 8 allows for charting a variety of spread combinations from 2 leg 1:1 ratio spreads to more advanced butterfly spreads. A control panel connected to the strategy allows for easy entry and management of spread trades.
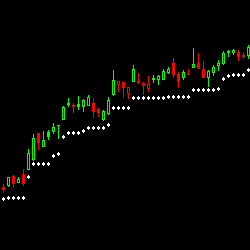
Based on ATR our Trailing Stop indicator has been designed to take all the hassle out of calculating and re-calculating your ‘stop losses.' It does this for you automatically. It also alerts if your stop is hit. A must for day and swing traders.
December 2, 2024
Mastering Sideways Markets With Auction Bars and Range Projections
November 19, 2024
Enhancing Your Automated Trading System: Key Insights from Best Pro Trade
November 14, 2024
NinjaTrader New Ecosystem Tools: October 2024 Edition
Enter Email for Updates