Trading coach with volume and price indicators.
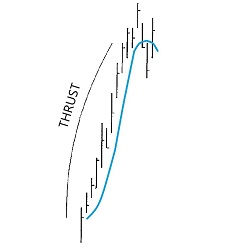
With this tool, traders can now find charts which have potential DiNapoli Directional patterns. Scan multiple markets & time frames in real time for Thrust and other patterns. Use as a chart indicator for easy recognition or as a market analyzer. Video instructions are included - try it today.
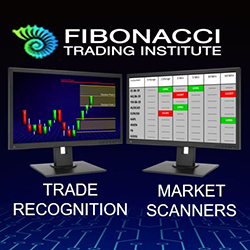
Trade like a pro with the proprietary Alpha Fibonacci System, traded globally by traders of all levels & instruments since 2011. The lifetime system includes Multi Market Scanners with group or private mentoring courses and a video library, modules and trading room included. [email protected]
chinese
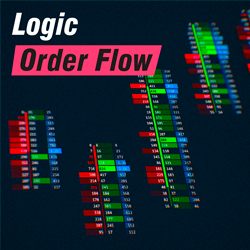
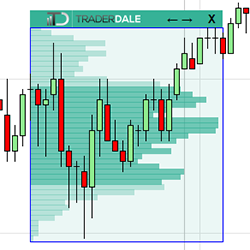
Logic order flow features unique and easy-to-use graphical options, one-click presets and configurations, a profile, footer, and databox for a complete market analysis. It guarantees the best visualization of patterns and zones, making this tool one of the best options on the market.
Transform your trading with 'Trading Psychology Toolkit' – a concise guide offering 23 practical strategies to master trading psychology. Developed from real world experience and scientific methods, it's an essential tool for emotional control and strategic thinking in trading.
We provide an all-in-one fully-featured automated trading strategy ready to trade any market (Futures, Stocks, Forex). We deliver the utmost reliability and frequently release new features free of charge. Schedule your FREE demo today and see how our members have boosted their trading performances.
Elevated trading with precision and autonomy. Trade smarter, hands-free! Does not activate everyday as it is looking for specific market opportunities.
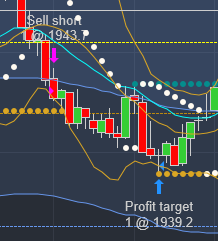
TD’s Flexible Volume Profile helps to reveal institutional trading activity and identifies the strongest support and resistance zones. The use of tick volume data makes it extremely precise leading to potential entries. It is easy to learn, simple to use, and extremely intuitive.
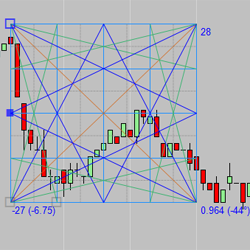
The IT_GannBox tool is fully loaded for chart analysis price prediction. This tool has all types of visual features and three modes of operation. Industry standard Fixed Ratio and FreeForm modes plus the custom FreeForm Ratio mode. Adding the IT_ChartSquare tool will allow visually accurate angles.
December 2, 2024
Mastering Sideways Markets With Auction Bars and Range Projections
November 19, 2024
Enhancing Your Automated Trading System: Key Insights from Best Pro Trade
November 14, 2024
NinjaTrader New Ecosystem Tools: October 2024 Edition
Enter Email for Updates